18 Simulation Animation
The Map View screen, in addition to being used to create custom networks, also serves to display the animation of simulation results after a successful simulation run.
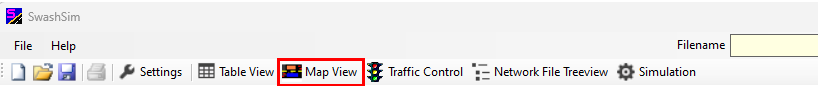
Figure 18.1: Map View Toolbar Button
18.1 Initiating Simulation Animation Mode
Once the simulation run has been successfully completed, go to the Map View screen and press the ‘Load Simulation Data’ button on the animation toolbar.

Figure 18.2: Animation Toolbar (pre-simulation run)
That will expand the animation toolbar options as shown below.

Figure 18.3: Animation Toolbar (post-simulation run)
18.2 Animation Playback Controls
18.2.1 Start/Pause/Stop
To start the animation, press the Play button.
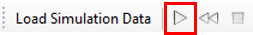
Figure 18.4: Animation Playback Controls (Play)
Once the animation has started, you can pause it by pressing the same button (it will display the Pause icon).
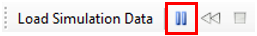
Figure 18.5: Animation Playback Controls (Pause)
To stop the animation before the simulation duration is reached, press the Stop button.
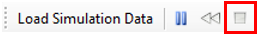
Figure 18.6: Animation Playback Controls (Stop)
18.2.2 Forward/Reverse
To change the direction of the animation (i.e., increasing or decreasing simulation time), press the forward/reverse buttons, which will toggle.
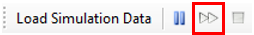
Figure 18.7: Animation Playback Controls (Forward Direction)
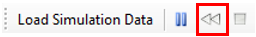
Figure 18.8: Animation Playback Controls (Reverse Direction)
18.2.3 Animation Speed
The animation speed can also be changed from 0.1X to 10X, using the ‘+’ and ‘-’ minus buttons, or the dropdown box. To use the latter, the animation must first be paused.
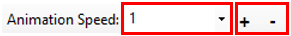
Figure 18.9: Animation Playback Controls (Speed Increase/Decrease)
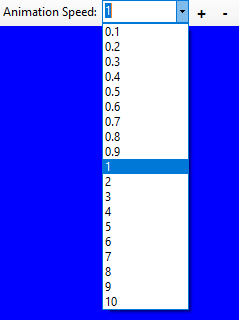
Figure 18.10: Animation Playback Controls (Speed Increase/Decrease)
18.2.4 Simulation Time
This field displays the current simulation time.
Figure 18.11: Simulation Time
To go directly to a specific time in the simulation, pause the simulation and then click directly on the time value with the mouse cursor (it will change to an edit box). Then type in the desired simulation time, and press ‘Enter’ or the ‘Go to’ button. When you resume the playback (press the Play button), the animation will start from the entered time. Note that once the time edit box is active, do not click in it again with the mouse, as this will immediately cancel the edit mode.
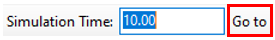
Figure 18.12: Simulation Time Direct Set
18.3 Display Options
18.3.1 Show Vehicle Information
Pressing the ‘Show Vehicle Info’ cycles through showing vehicle IDs, vehicle model #’s, or neither on the vehicle graphics objects. The vehicle IDs correspond to the sequence in which vehicles entered the network. The vehicle model IDs correspond to the specific vehicle type (e.g., Honda Accord, Ford F150, etc.).
Figure 18.13: Show Vehicle IDs
Figure 18.14: Show Vehicle IDs
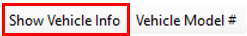
Figure 18.15: Show Vehicle IDs
The figure below demonstrates the display of vehicle IDs.
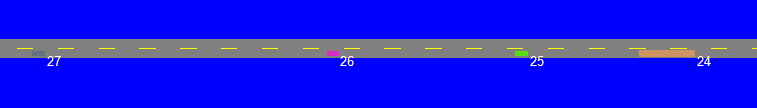
Figure 18.16: Show Vehicle IDs
18.3.2 Vehicle Properties
While the animation is running or paused, individual vehicles can be clicked on (use the left mouse button and double click) to display a window that provides various details about that status of the vehicle (see Figure below). If you experience difficulty in clicking on a vehicle, try pausing the animation first.
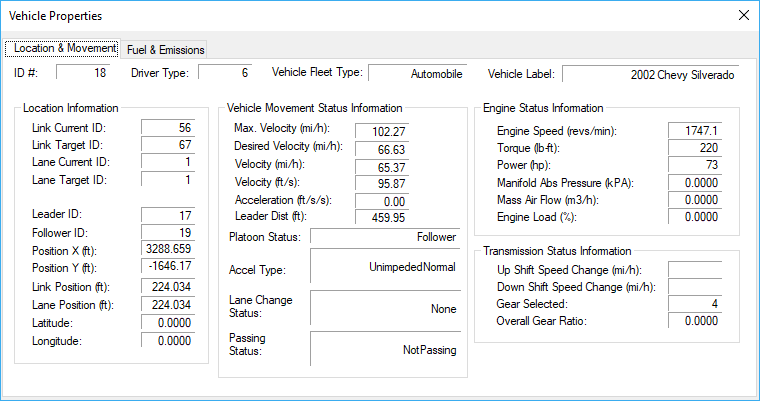
Figure 18.17: Vehicle Properties
18.3.3 Signal Controllers
Pressing the ‘Signal Controllers’ toobar button will display a list of the signal controllers contained in the network.

Figure 18.18: Animation Signal Control Toolbar Button
Checking the ‘Show’ button for a listed controller will display the signal phasing and timing dialog for the selected signal controller.
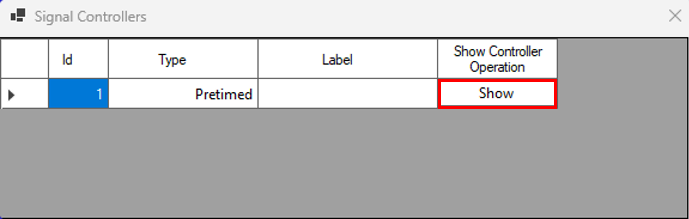
Figure 18.19: Signal Controller List
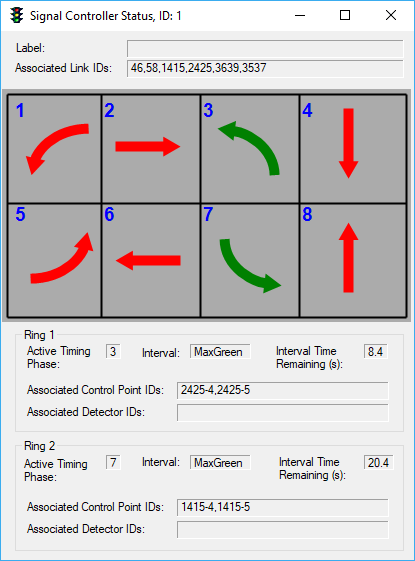
Figure 18.20: Signal Controller
During the animation, the movement arrow colors will match with the current signal indication (i.e., green, yellow, red) for that movement. This display is coordinated with the control point colors displayed on the intersection (see Figure below).
- Active Timing Phase – This represents the current active movement, colored in green. Recall that in the dual-ring diagram, phases 1 through 4 run from left to right in the top row and phases 5 through 8 run from left to right in the bottom row.
- Interval – Displays the active timing interval (i.e., green, yellow, all-red).
- Interval Time Remaining – Displays the time remaining in the active interval.
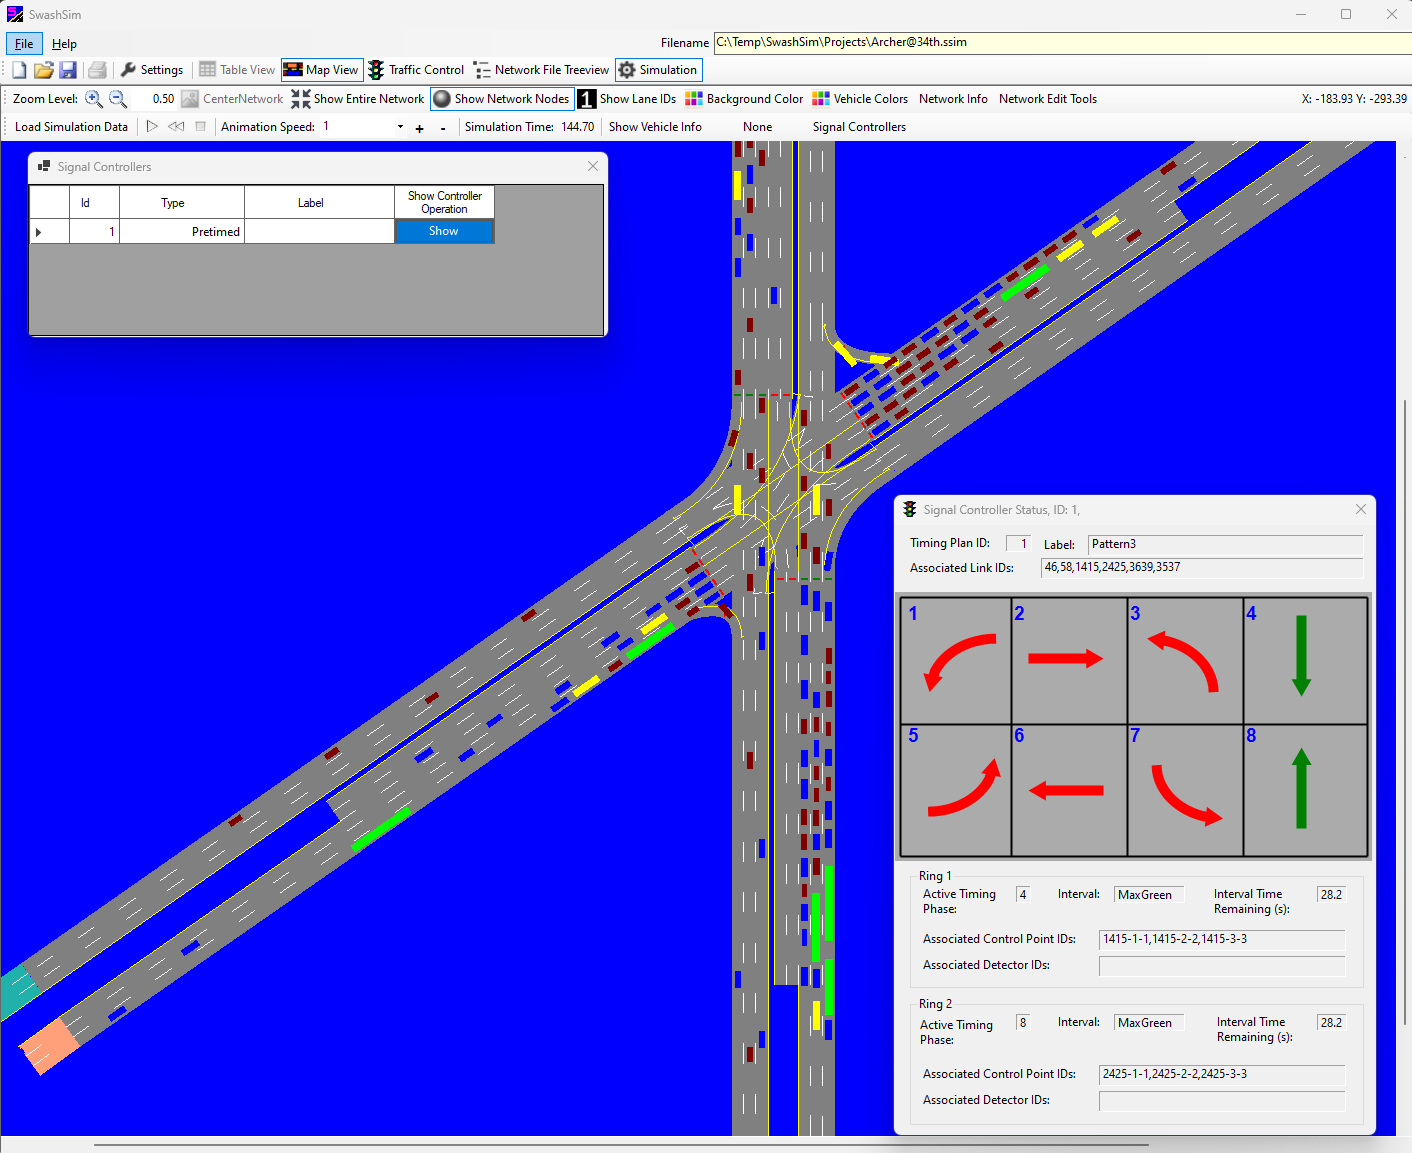
Figure 18.21: Signal Controller Animation