29 Emissions and Fuel Consumption
29.1 Vehicle-Specific Power (VSP) Emission
Frey, Zhang, and Rouphail (2008) used vehicle specific power as an indicator of engine power demand. For a typical light duty vehicle, VSP is:
\[VSP=0.278v \times [0.305a+9.81 \times \sin(a+\tan (\frac{r}{100})+0.132]+0.0000065v^3\]
where:
\(VSP=\) vehicle specific power (kw/ton),
\(v=\) speed (km/h),
\(a=\) acceleration (km/h/s), and
\(r=\) road grade (%).
| VSP Mode | Definition | NO (mg/s) | HC (mg/s) | CO (mg/s) | CO\({_2}\) (g/s) | Fuel (g/s) |
|---|---|---|---|---|---|---|
| 1 | \(VSP<-2\) | 0.12 | 0.076 | 1.83 | 1.30 | 0.41 |
| 2 | \(-2 \le VSP<0\) | 0.092 | 0.083 | 1.86 | 1.43 | 0.45 |
| 3 | \(0 \le VSP<1\) | 0.026 | 0.056 | 0.90 | 0.97 | 0.31 |
| 4 | \(1 \le VSP<4\) | 0.14 | 0.12 | 2.59 | 2.03 | 0.64 |
| 5 | \(4 \le VSP<7\) | 0.21 | 0.16 | 3.68 | 2.74 | 0.87 |
| 6 | \(7 \leq VSP<10\) | 0.23 | 0.20 | 4.74 | 3.42 | 1.08 |
| 7 | \(10 \le VSP<13\) | 0.29 | 0.24 | 5.73 | 4.02 | 1.27 |
| 8 | \(13 \le VSP<16\) | 0.32 | 0.28 | 6.18 | 4.56 | 1.44 |
| 9 | \(16 \le VSP<19\) | 0.37 | 0.31 | 7.09 | 5.08 | 1.61 |
| 10 | \(19 \le VSP<23\) | 0.47 | 0.35 | 7.81 | 5.61 | 1.77 |
| 11 | \(23 \le VSP<28\) | 0.59 | 0.38 | 8.36 | 6.05 | 1.91 |
| 12 | \(28 \le VSP<33\) | 0.68 | 0.42 | 9.01 | 6.41 | 2.03 |
| 13 | \(33 \le VSP<39\) | 0.79 | 0.46 | 10.5 | 6.86 | 2.17 |
| 14 | \(39 \le VSP\) | 0.97 | 0.48 | 10.9 | 7.41 | 2.34 |
The average 95% confidence intervals for these VSP modes in % are \(\pm 5\), \(\pm 2\), \(\pm 3\), \(\pm 1\), and \(\pm 1\) for NO, HC, CO, \(\text{CO}{_2}\), and fuel, respectively. The unit for VSP is kw/ton.
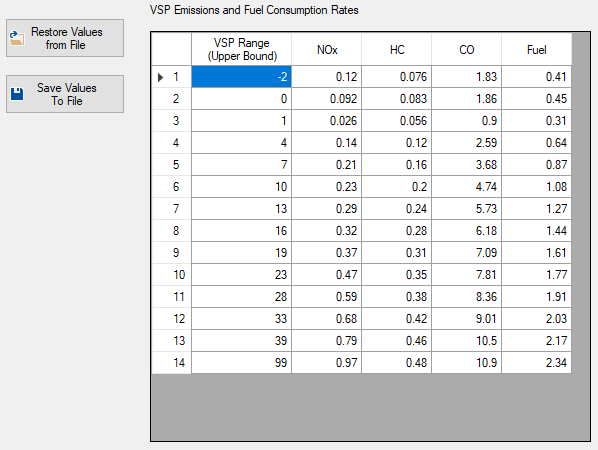
Figure 29.1: VSP Emissions Settings
Additional information about how this methodology is incorporated into simulation is described in Washburn et al. (2015).
29.2 OBD-based emissions/fuel use calculations
The following calculation methodology is described in Hu, Frey, and Washburn (2016) and Washburn et al. (2017).
The RPM value used in the calculations of this section is obtained from the calculations described in Maximum Acceleration (rearranged to solve for engine speed).
- Calculate VSP, from VSP-based emissions/fuel use calculations
- Calculate
\[MAP\times RPM=\text{min}(a\times VSP^b\times c,d)\]
where:
\(a=\) scaling parameter,
\(b=\) power parameter,
\(c=\) multiplicative bias correction factor (equals 1.0 for all cases), and
\(d=\) additive bias correction factor.
according to the values in the following Table.
| Vehicle | Year | 2005 | 2005 | 2008 | 2004 | 2001 | 2009 | 1998 | 2002 | 2010 | 1998 |
|---|---|---|---|---|---|---|---|---|---|---|---|
| Make | Chevrolet | Mazda | Chevrolet | Pontiac | Volvo | Honda | Buick | Chevrolet | Ford | Chevrolet | |
| Model | Tahoe | 6 | Impala | Grand AM GT | S40 | Civic | Century | Silverado | F150 | S10 | |
| \(MAP \times RPM\) | \(a\) | 38100 | 58700 | 44800 | 44300 | 59900 | 59100 | 55200 | 37900 | 36600 | 43200 |
| NULL | \(b\) | 0.42 | 0.39 | 0.42 | 0.42 | 0.37 | 0.43 | 0.35 | 0.44 | 0.44 | 0.35 |
| NULL | \(c\) | 32000 | 45000 | 40000 | 36300 | 45400 | 37800 | 43600 | 34400 | 32100 | 33100 |
- Calculate manifold absolute pressure
\[MAP=\frac{MAP\times RPM}{RPM}\]
- Calculate mass air flow
\[MassAirFlow=\frac{MAP\times EngineDisplacement\times\frac{RPM}{60\times EngineStrokesPerCycle}\times EngineVolumetricEfficiency}{1545.349\times (EngineIntakeAirTemp+273.15)}\]
\[EngineLoad = \frac{{(MAP \times RPM + 66189)}}{{3556.4}}\]
\[{m_i} = a{(MAP \times RPM)^b} \times c + d\]
\[{m_{NOx}} = \frac{{a'}}{{{{(MAP \times RPM)}^{0.5}}}}\text{exp}\left( {\frac{{-b'}}{{MAP \times RPM}}} \right)\]
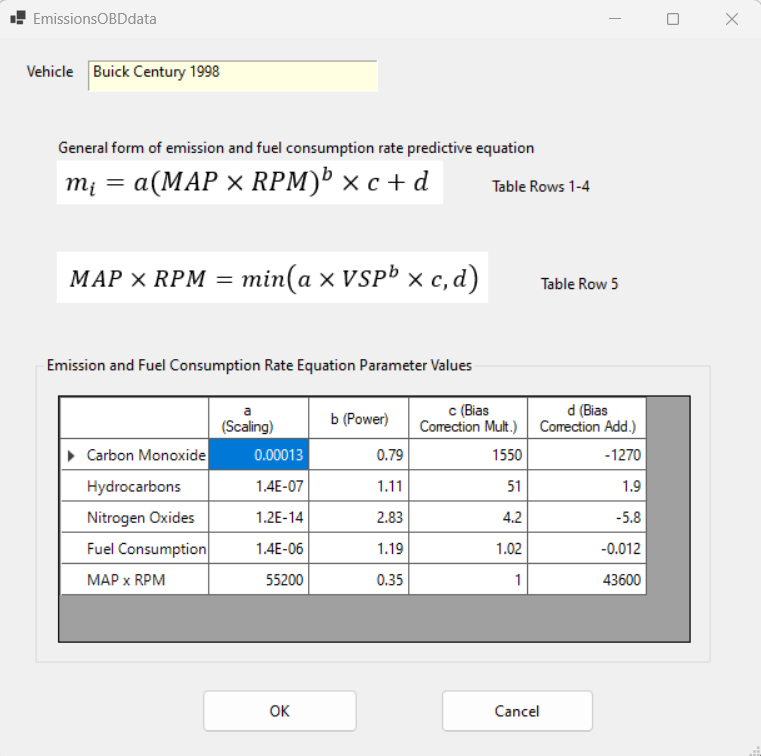
Figure 29.2: OBD Emissions Settings