9 Custom Network Editor
Network creation in Custom mode is done in the Map View screen.
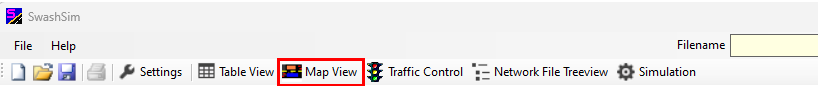
Figure 9.1: Map View Toolbar Button
After selecting the ‘Custom’ option in the New Project dialog, the program will switch to Map View. The following figure shows the Map View, with a previously created network displayed. When starting a new project, the map area will be empty. Press the Network Edit Tools toolbar button (1) to toggle on the display of the network editing toolbar (2).
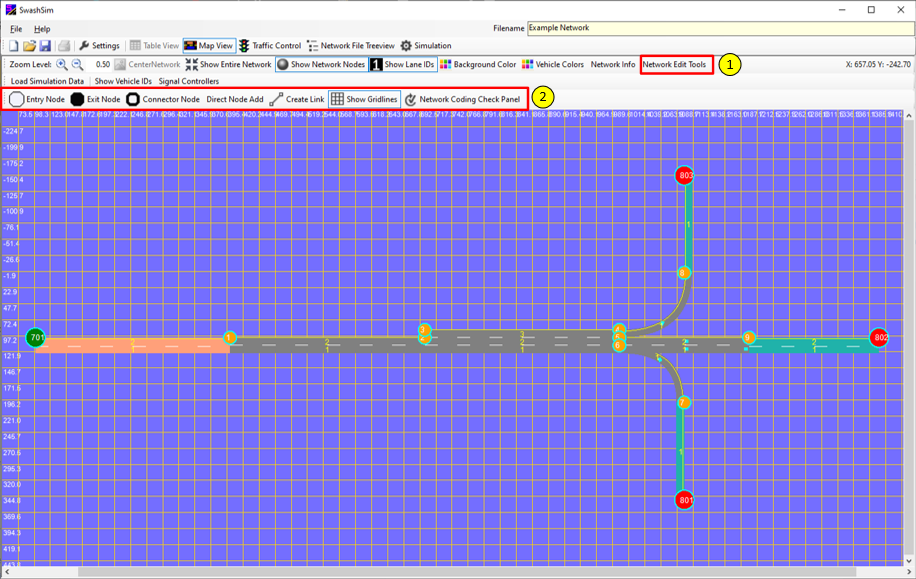
Figure 9.2: Map View (1)
There are two ways to add nodes to the map:
- Direct Node Add: With this method, node type and coordinate values are specified through a dialog rather than interacting with the map. Press the Direct Node Add button (4) for this method. After closing the dialog, the node will be displayed on the map.
- Use the cursor and map to create nodes: With this method, you use the Entry Node (1), Exit Node (2), and Connector Node (3) buttons to place the respective nodes on the map with the cursor. Note that these buttons work in a toggle mode–you press the toolbar button to turn on/off the node adding functionality for the respective node type. After placing a node on the map, you can edit the node coordinates through a dialog accessed through the Network Info panel (see Node Data Screen section below).
Note that both of these methods can be used simultaneously to create nodes for a given network.
To connect two nodes with a link, press the Create Link button (5). Note that this button will not be active if one of the add node buttons is active. Pressing the Create Link button will display a dialog that will allow you to create a link connecting any two existing nodes and all of the corresponding link properties (see Link Data Screen section below).
Note the following:
- to create an entry link, you must have added at least one entry node (numbered 701-799) and one connector node (numbered 1-699).
- to create an exit link, you must have added at least one exit node (numbered 801-899) and one connector node.
- to create a connector link, you must have added at least two connector nodes.
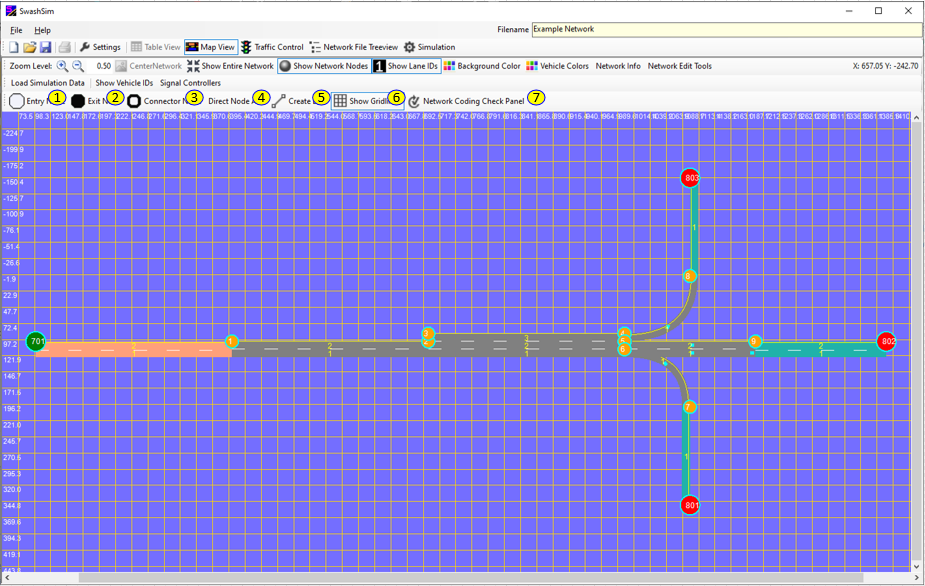
Figure 9.3: Map View (2)
Pressing the ‘Network Coding Check Panel’ button (7) will toggle on/off a panel at the bottom of the screen for displaying network coding errors/warnings. Press the ‘Check for Network Coding Errors/Warnings’ button in this lower panel to identify any network coding issues. Once the message “No network coding errors were found.” is displayed, you will be able to successfully run a simulation for your network. Since a node can be used for more than one link, it is best to not place more than one node at the same x/y position, although it will not cause any errors. It just makes network coding debugging more challenging since you will only see the top node displayed (usually the highest numbered). To identify all nodes with the exact same x/y coordinates, press the ‘Check for Overlapping Nodes button’. Note that you can select the text in the output window, copy it (with the keyboard combination of CTRL+C) and paste into any text editor application.
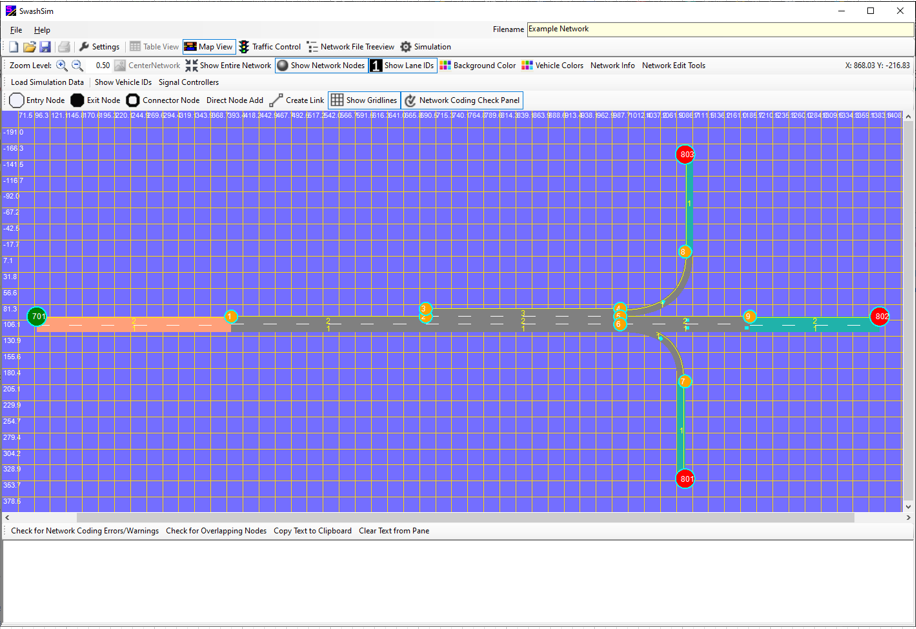
Figure 9.4: Map View (3)
The Network Info button will toggle on/off a panel that provides a tabular listing of links and nodes present in the network.

Figure 9.5: Map View–Networ Info
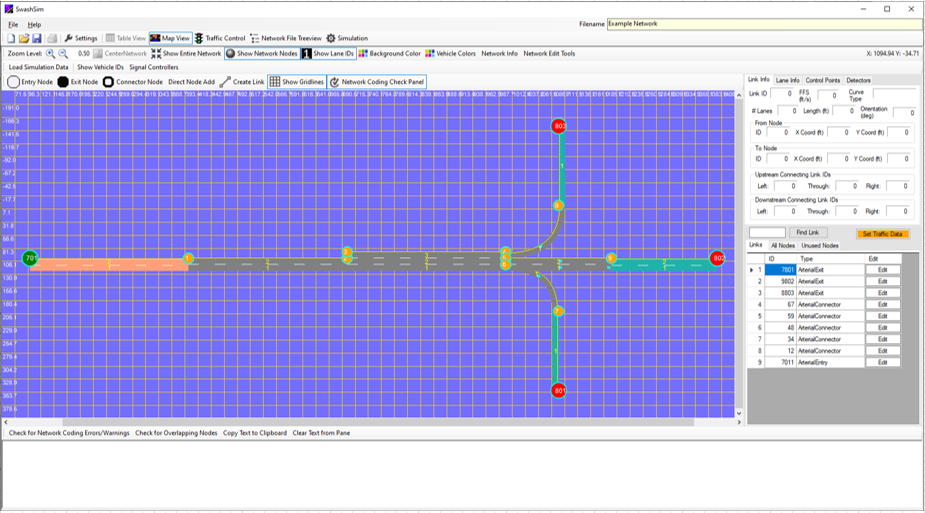
Figure 9.6: Map View (4)
If a specific link is selected in this table (clicking on the row header) or clicked on in the map, the top part of the network information panel will display the values of some of the more frequently referenced link properties. The link and node editing dialogs can also be accessed from the table displays.
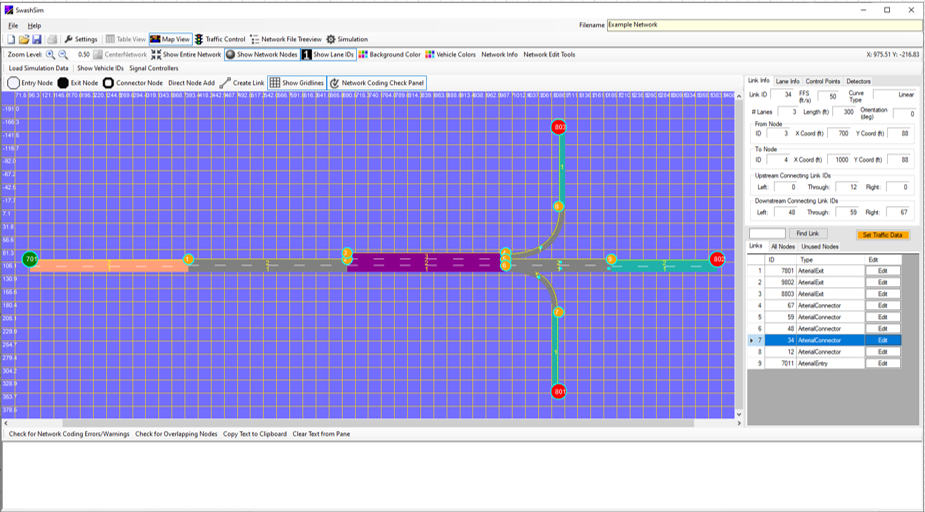
Figure 9.7: Map View (5)
9.1 Node Data Screen
The Node Data screen (see Figure below) can be loaded by pressing the Edit button for an existing node in the Network Info ‘All Nodes’ listing. Nodes placed on the map that are connected to any links will also be listed separately in the ‘Unused Nodes’ listing. Unused nodes can be deleted. Nodes connected to one or more links can only be deleted after they have been disconnected from all links. Node coordinates can be revised for unused links in this dialog. The coordinates for nodes that are connected to a link must be changed from the Link Data dialog. A node ID value can be changed by pressing the Change ID Value button and entering a new ID value. The program will first check if the ID is currently in use by another node. If the ID value is changed, the corresponding link IDs that are connected to the subject node will be updated.
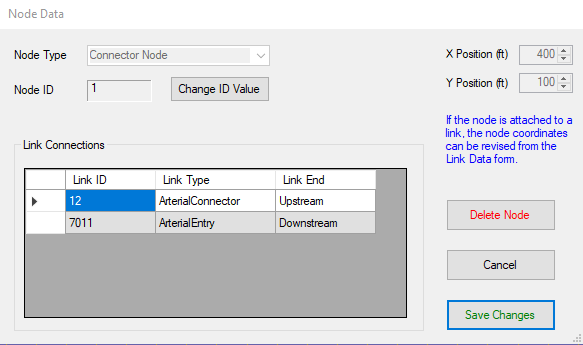
Figure 9.8: Node Data Dialog
9.2 Link Data Screen
The Link Data screen can be loaded in three ways:
- Pressing the Create Link button
- Pressing the Edit button for an existing link in the Network Info ‘Links’ listing
- Right-clicking on an existing link with the mouse and selecting the Edit Link option in the popup menu
Select the link type:
- Arterial Connector: Use this link type for any type of roadway that is not a freeway or two-lane highway
- Arterial Entry
- Arterial Exit
- Freeway: A freeway connector link
- Freeway On-Ramp: Use for a link that serves as an on-ramp to the freeway mainline
- Freeway Off-Ramp: Use for a link that serves as an off-ramp from the freeway mainline
- Freeway Mainline Entry: An entry link to the freeway mainline
- Freeway Entry: An entry link (upstream) that connects to a freeway on-ramp link (downstream)
- Freeway Exit: An exit link (downstream) that connects to either the freeway mainline (upstream) or a freeway off-ramp link (upstream)
- Two-Lane Highway Basic: A two-lane highway connector link that consists of one lane in the travel direction
- Two-Lane Highway Passing Lane: A two-lane highway connector link that consists of two lanes in the travel direction
- Two-Lane Highway Entry
- Two-Lane Highway Exit
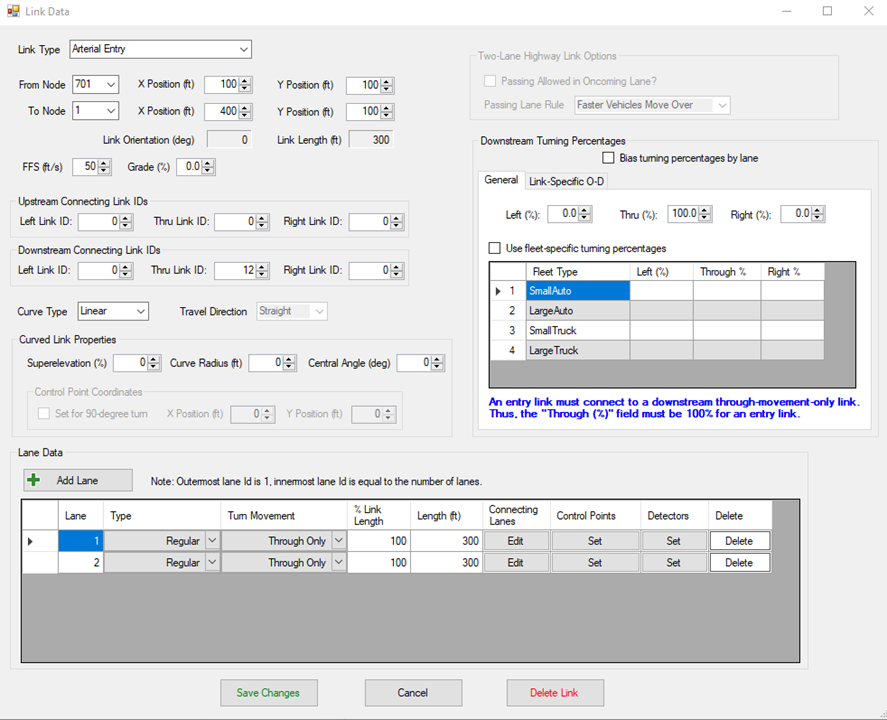
Figure 9.9: Link Data Dialog
The upstream and downstream node number fields will initially be populated with values, as follows:
- Entry Link: the upstream node number will be +1 greater than the currently largest entry node number (e.g., 701 -> 702). The downstream node number will be +1 greater than the currently largest connector node number (e.g., 1 -> 2).
- Connector Link: the upstream node number will be +1, and the downstream node number +2, greater than the currently largest connector node number.
- Exit Link: the upstream node number will be +1 greater than the currently largest connector node number (e.g., 2 -> 3). The downstream node number will be +1 greater than the currently largest exit node number (e.g., 801 -> 802).
9.2.1 Lane Data
9.2.1.1 Connecting Lanes
This dialog is used to specify the upstream and downstream connecting ID’s for each lane. An example of how to specify this coding can be found here.
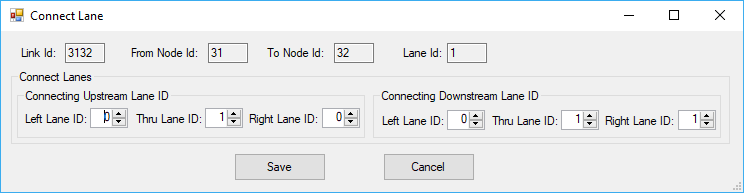
Figure 9.10: Upstream/Downstream Connecting Lane IDs
9.2.1.2 Detectors
This dialog is used to place one or more detectors in the selected lane for the selected link. Press the ‘Add Detector’ button to place a detector. The ‘Position (ft)’ field is calculated automatically, based on the entered ‘Position (%)’ value. These values are referenced to the upstream start of the link. Information about detector objects can be found here.
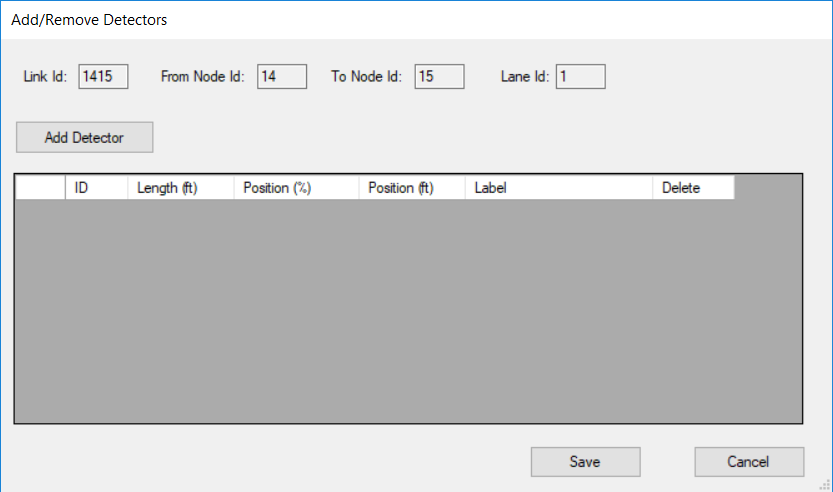
Figure 9.11: Detectors Screen
9.2.1.3 Control Points
This dialog is used to place one or more traffic control points in the selected lane for the selected link. Press the ‘Add Control Point’ button to place a control point. The ‘Position (ft)’ field is calculated automatically, based on the entered ‘Position (%)’ value. These values are referenced to the upstream start of the link. Information about traffic control point objects can be found here.
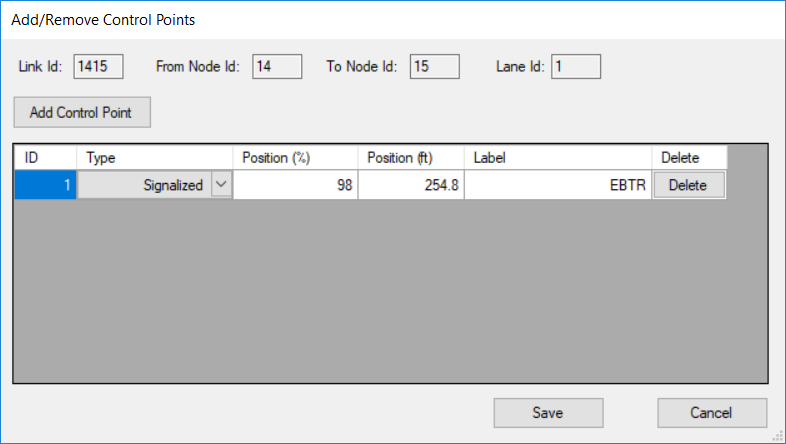
Figure 9.12: Control Points Screen
9.2.2 Traffic Data
Traffic data is entered for entry links. The applicable links have a yellow-colored ‘Edit’ traffic data button. This button loads the following input screen.
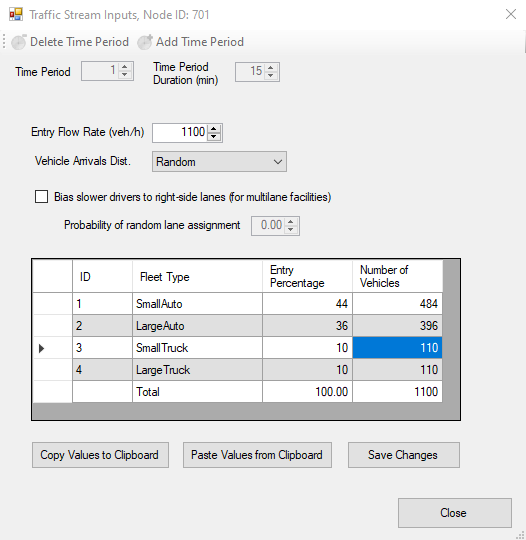
Figure 9.13: Traffic Data Entry Screen
In this screen, the entry flow rate and fleet type percentages are input. To save your inputs before exiting the input screen, press the “Save Changes” button. Values from the fleet percentages table can be copied from one input screen to another by selecting “Copy Values to Clipboard” in one screen and selecting “Paste Values from Clipboard” in another.
9.3 Map Manipulation Functions and Display Options
The tools in the following toolbar provide a variety of functions for manipulating the display of the network.

Figure 9.14: Map View Toolbar
The buttons shown below can be used to zoom in/out the network display. The scroll wheel of a mouse can also be used to zoom the network display in and out.

Figure 9.15: Map View Zoom In/Out Buttons
Pressing the ‘Show Entire Network’ button will display the entire network within the Map View screen boundaries. To re-position the network within the Map View screen, hold down the left mouse button and move the mouse as appropriate. The Map View screen scroll bars can also be used for this purpose.
Figure 9.16: Show Entire Network Button
The ‘Show Network Nodes’ button is used to toggle on/off the display of the nodes on the network.
Figure 9.17: Show Network Nodes (1)

Figure 9.18: Show Network Nodes (2)
Selecting a link, by clicking on it with the left mouse button, will change the color of the link to purple. This selection will also be coordinated with the link/lane properties display, if enabled, as discussed earlier in this chapter.
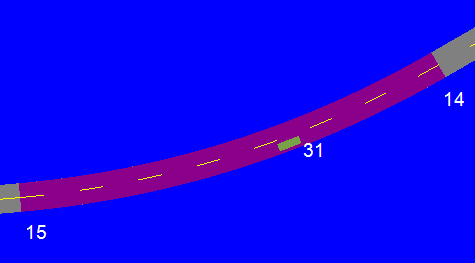
Figure 9.19: Selecting a Link
The ‘Show Lane IDs’ button is used to toggle on/off the display of lane numbers within the links.

Figure 9.20: Show Lane IDs
Pressing the ‘Background Color’ button will open a new dialog that provides the ability to change the background color within the Map View.
Figure 9.21: Show Lane IDs
Pressing the ‘Vehicle Colors’ button will open a new dialog that provides the ability to change the colors used for the vehicle objects during a simulation animation.

Figure 9.22: Show Lane IDs