Chapter 6 HCM Merge/Diverge Segments
6.1 Introduction
Definition: A ramp is a length of roadway providing an exclusive connection between highway facilities.
A ramp roadway may consist of up to three geometric elements of interest:
- The ramp-freeway junction
- The ramp roadway
- The ramp-street junction
This presentation focuses on the ramp-freeway junction.
On-ramp and off-ramp connections to the freeway create localized sources of increased traffic turbulence (or friction).
These points on the freeway need to be analyzed with a separate procedure.
6.2 On- and Off-Ramp Influence Areas
Merging and diverging activity is most intense in the two freeway lanes closest to the ramp and accel/decel lane and the operational influence area of merge/diverge activity extends for approximately 1500 feet from the ramp-freeway intersection point.
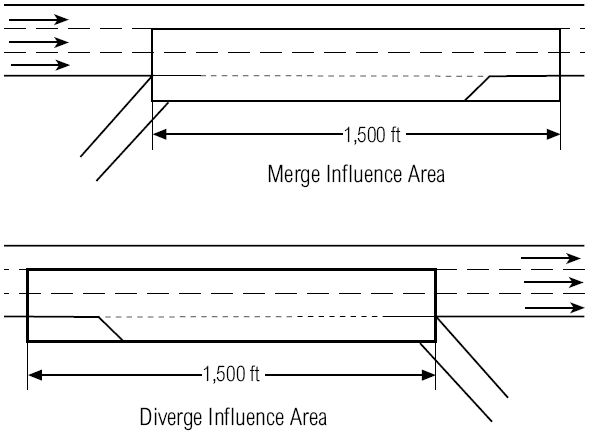
Figure 6.1: Merge/Diverge Configurations
6.3 Accel/Decel Lanes
A critical geometric parameter influencing operations at a merge or diverge area is the length of the acceleration (\(L_A\)) or deceleration (\(L_D\)) lane.
The length of such lanes is measured from the point at which the left edge of the ramp lanes and the right edge of the freeway lanes converge to the end of the taper segment connecting the ramp to the freeway.
The point of convergence is typically defined by painted markings or physical barriers, or both.
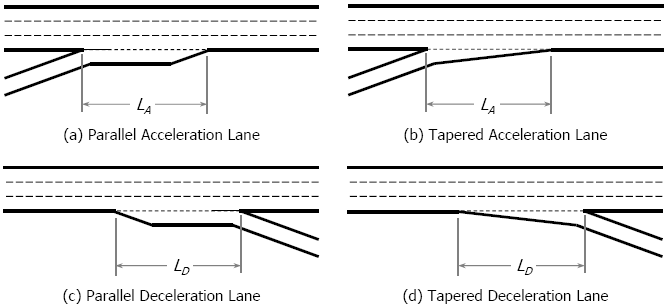
Figure 6.2: Accel/Decel Lanes
6.4 Analysis Methodology
The basic approach to the analysis of merge and diverge areas focuses on an influence area of 1500 ft, including the acceleration or deceleration lane and Lanes 1 and 2 (the two outside lanes) of the freeway.
The analysis methodology has four major steps and one optional step.
- Specify Inputs and Convert Demand Volumes to Demand Flow Rates
- Estimate the Approaching Flow Rate in Lanes 1 and 2 of the Freeway Immediately Upstream of the Ramp Influence Area
- Estimate the Capacity of the Ramp-Freeway Junction and Compare to Demand Flow Rates
- Estimate Density in the Ramp Influence Area and Determine the Level of Service
- Estimate Speeds in the Vicinity of Ramp–Freeway Junctions (optional)
6.4.1 Step 1: Volume Conversion
Volumes must be converted to equivalent maximum flow rates in passenger cars per hour for the peak 15 minutes of the hour of interest.
This can be accomplished by using the following equation.
\[v_{p} = \frac{V}{PHF \times f_{HV}}\tag{HCM Eq. 14-1}\]
\(v_{p}\) = 15-min passenger car equivalent flow rate in pc/h/ln,
\(V\) = hourly volume in veh/h,
\(PHF\) = peak-hour factor, and
\(f_{HV}\) = heavy-vehicle adjustment factor.
6.4.2 Step 2: Estimate Flow Entering Lanes 1 and 2 (V12)
The flow entering Lanes 1 and 2 (V12) immediately upstream of the merge influence area or the beginning of the deceleration lane at an off-ramp is estimated.
This flow is a major determinant of operating characteristics within the ramp influence area.
Studies have shown that the principal influences on lane distribution of freeway vehicles immediately upstream of merge or diverge areas are the following:
\(V_{F}\), total freeway flow approaching the merge or diverge area (pc/h)
\(V_{R}\), total ramp flow (pc/h)
\(L_{A}\) or \(L_{D}\), total length of the acceleration or deceleration lane (ft)
\(S_{FR}\), free-flow speed of ramp at point of merge or diverge (mi/h)
Lane distribution at a given ramp may also be influenced by flows on adjacent upstream and downstream ramps.
When nearby ramps input vehicles into or remove them from Lane 1, the lane distribution of total vehicles may be significantly altered.
Several variables are critical:
\(V_{U}\), total flow on an upstream adjacent ramp (pc/h)
\(V_{D}\), total flow on a downstream adjacent ramp (pc/h)
\(D_{U}\), distance to the adjacent upstream ramp (ft)
\(D_{D}\), distance to the adjacent downstream ramp (ft)
Whether upstream or downstream adjacent ramps have a significant influence on lane distribution depends on the size of the freeway, the specific combination of upstream or downstream ramp (or both), and the distances and flows involved.
6.4.3 Step 2: Model Structure (On-ramps)
The model form for prediction of \(v_{12}\) immediately upstream of single-lane, right-hand on-ramps is:
\[V_{12} = V_{F} \times P_{FM}\tag{HCM Eq. 14-2}\]
\(P_{FM}\) is the proportion of freeway vehicles remaining in Lanes 1 and 2 immediately upstream of an on-ramp
6.4.4 Step 2: Model Structure (Off-ramps)
The model for single-lane, right-hand off-ramps must take a different form.
\(v_{12}\) for off-ramps is defined immediately upstream of the beginning of the deceleration lane.
Thus, \(v_{12}\) must include \(v_{R}\), the off-ramp flow.
The main question is the proportion of through vehicles remaining in Lanes 1 and 2 at this point.
A model expressing this logic is: \[V_{12} = V_{R}+ (V_F-V_R) \times P_{FD}\tag{HCM Eq. 14-8}\]
This model focuses on predicting the choice to be made by approaching freeway drivers not exiting at the ramp (i.e., drivers with a choice to make).
6.4.5 Step 2: \(P_{FM}\) Equations for On-ramps
HCM Exhibit 14-8
| No. of Freeway Lanes\(^a\) | Model(s) for Determining \(P_{FM}\) |
|---|---|
| 4 | \(P_{FM} = 1.000\) |
| 6 (Eq. 14-3) | \(P_{FM} = 0.5775 + 0.000028(L_{A})\) |
| 6 (Eq. 14-4) | \(P_{FM} = 0.7289 - 0.0000135(v_F + v_R) - 0.003296(S_{FR}) + 0.000063(L_{UP})\) |
| 6 (Eq. 14-5) | \(P_{FM} = 0.5487 + 0.2628(v_D/L_{DOWN})\) |
| 8 For \(v_F/S_{FR} \leq 72\) | \(P_{FM} = 0.2178 - 0.000125(v_R) + 0.01115(L_A/S_{FR})\) |
| 8 For \(v_F/S_{FR} > 72\) | \(P_{FM} = 0.2178 - 0.000125(v_R)\) |
Selecting equations for \(P_{FM}\) for six-lane freeways
| Adjacent Upstream Ramp | Subject Ramp | Adjacent Downstream Ramp | Equation(s) Used |
|---|---|---|---|
| None | On | None | Equation 14-3 |
| None | On | On | Equation 14-3 |
| None | On | Off | Equation 14-5 or 14-3 |
| On | On | None | Equation 14-3 |
| Off | On | None | Equation 14-4 or 14-3 |
| On | On | On | Equation 14-3 |
| On | On | Off | Equation 14-5 or 14-3 |
| Off | On | On | Equation 14-4 or 14-3 |
| Off | On | Off | Equation 14-5 or 14-4 or 14-3 |
Notes:
(a) 4 lanes = two lanes in each direction; 6 lanes = three lanes in each direction; 8 lanes = four lanes in each direction.
If an adjacent diverge on a six-lane freeway is not a one-lane, right-side off-ramp, use Equation 14-3.
6.4.6 Step 2: \(P_{FD}\) Equations for Off-ramps
HCM Exhibit 14-9
| No. of Freeway Lanes\(^a\) | Model(s) for Determining \(P_{FD}\) |
|---|---|
| 4 | \(P_{FD} = 1.000\) |
| 6 (Eq. 14-9) | \(P_{FD} = 0.760 - 0.000025(v_F) - 0.000046(v_R)\) |
| 6 (Eq. 14-10) | \(P_{FD} = 0.717 - 0.000039(v_F) + 0.604(v_U/L_{UP}) \text{ when} \text{ } v_U/L_{UP} \leq 0.2^b\) |
| 6 (Eq. 14-11) | \(P_{FD} = 0.616 - 0.000021(v_F) + 0.124(v_D/L_{DOWN})\) |
| 8 | \(P_{FD} = 0.436\) |
Selecting equations for \(P_{FD}\) for six-lane freeways
| Adjacent Upstream Ramp | Subject Ramp | Adjacent Downstream Ramp | Equation(s) Used |
|---|---|---|---|
| None | Off | None | Equation 14-9 |
| None | Off | On | Equation 14-9 |
| None | Off | Off | Equation 14-11 or 14-9 |
| On | Off | None | Equation 14-10 or 14-9 |
| Off | Off | None | Equation 14-9 |
| On | Off | On | Equation 14-10 or 14-9 |
| On | Off | Off | Equation 14-11, 14-10, or 14-9 |
| Off | Off | On | Equation 14-9 |
| Off | Off | Off | Equation 14-11 or 14-9 |
Notes:
(a) 4 lanes = two lanes in each direction; 6 lanes = three lanes in each direction; 8 lanes = four lanes in each direction.
(b) When \(v_U/L_{UP} > 0.2\), use Equation 14-9.
If an adjacent ramp on a six-lane freeway is not a one-lane, right-side off-ramp, use Equation 14-9.
Check Reasonableness of Lane Distribution Estimation
1. The average flow per lane in the outer lanes of the freeway (lanes other than 1 and 2) should not be higher than 2,700 pc/h/ln.
2. The average flow per lane in outer lanes should not be higher than 1.5 times the average flow in Lanes 1 and 2.
Six-Lane Freeway (3 lanes per direction)
\[v_{3} = v_{F}-v_{12}\tag{HCM Eq. 14-14}\]
- If \(v_{3}\) is greater than 2,700 pc/h/ln, use Eq. 14-15:
\[v_{12a} = {v_{F}-2700}\tag{HCM Eq. 14-15}\]
- If \(v_{3}\) is greater than \(1.5 \times \frac{v_{12}}{2}\), use Eq. 14-16:
\[v_{12a} = \frac{v_{F}}{1.75}\tag{HCM Eq. 14-16}\]
where \(v_{12a}\) equals the adjusted flow rate in Lanes 1 and 2 immediately upstream of the ramp influence area (pc/h)
If both limitations on outer lane flow rate are violated, the result yielding the highest value of \(v_{12a}\) is used. The adjusted value replaces the original value of \(v_{12}\) and the analysis continues.
Eight-Lane Freeway (4 lanes per direction)
If \(v_{av34}\) is greater than 2,700 pc/h/ln, use Eq. 14-18:
\[v_{av34} = {v_{F}-5400}\tag{HCM Eq. 14-18}\]If \(v_{av34}\) is greater than \(1.5 \times \frac{v_{12}}{2}\), use Eq. 14-19:
\[v_{12a} = \frac{v_{F}}{2.5}\tag{HCM Eq. 14-19}\]where \(v_{12a}\) equals the adjusted flow rate in Lanes 1 and 2 immediately upstream of the ramp influence area (pc/h)
If both limitations on outer lane flow rate are violated, the result yielding the highest value of \(v_{12a}\) is used. The adjusted value replaces the original value of \(v_{12}\) and the analysis continues.
6.4.7 Step 3: Estimate Capacity of Ramp-Freeway Junction
Determine critical capacity values and compare to demand flows.
The comparison determines whether the merge or diverge area is likely to break down.
Capacity is evaluated at two points:
- the maximum total flow departing from the merge or diverge area (\(V_{FO}\)) and
- the maximum total flow that can reasonably enter the merge or diverge influence area (\(V_{R12}\) for on-ramps; \(V_{12}\) for off-ramps).
If demand exceeds either of these two capacity values, breakdown may occur.
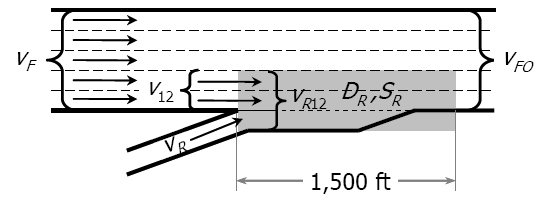
Figure 6.3: Merge Volume
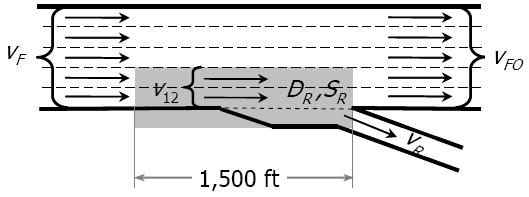
Figure 6.4: Diverge Volume
Capacity Values: Merge and Diverge Areas
The capacity of merge areas is controlled by either of the following two criteria:
- the total flow leaving the merge area on the downstream freeway (\(V_{FO}\)) or
- the maximum flow entering the merge influence area (\(V_{R12}\)).
The total flow leaving the merge area is subject to the constraints of the downstream freeway section.
There is no evidence that the turbulence of the merge area causes the downstream freeway capacity to be less than that of a basic freeway segment.
Thus, for stable flow operations to exist, the sum of the merging flows cannot exceed the capacity of the downstream freeway segment.
It is possible, however, to experience congestion in the merge influence area even if the capacity of the downstream freeway segment is adequate.
Studies have shown that there is a practical maximum flow that may enter the merge influence area and still maintain stable operations.
In a ramp merge junction, both the flow in Lanes 1 and 2 and the flow in the on-ramp enter the merge influence area.
Thus, \[V_{R12} = V_{R}+ V_{12}\tag{HCM Eq. 14-20}\]
The capacity values for merge areas are shown in the table (HCM Exhibit 14-10) at the end of this section:
If the \(V_{R12}\) maximum flow is exceeded, LOS F conditions will not necessarily exist, as traffic flow will redistribute to utilize excess capacity in outer lanes.
If the freeway capacity is exceeded, queuing conditions are expected to exist, and LOS is F.
If LOS F exists, the analysis ends. The freeway facilities procedure can be applied in this case.
Where stable operations are expected, the next step of the analysis—estimation of density in the merge influence area—is implemented to find the level of service.
Three capacity values need to be checked in a diverge area:
- the capacity of the upstream freeway lanes approaching the diverge area,
- the capacity of the downstream freeway lanes departing the diverge area, and
- the capacity of the off-ramp.
The total flow that can leave the diverge area is generally limited by the capacity of the freeway lanes approaching the diverge junction.
In all appropriate diverge designs, the number of lanes leaving the diverge area is either equal to or one greater than the number entering.
This departing flow is designated \(V_{FO}\).
- The flow entering Lanes 1 and 2 just upstream of the deceleration lane is simply the flow in Lanes 1 and 2 (\(v_{12}\)).
This flow includes the off-ramp flow.
The table below (HCM Exhibit 14-10) provides capacity values for the first two capacity checks.
Capacity, in pc/h, of Upstream or Downstream Freeway Segmenta
| FFS (mi/h) | 2 lanes | 3 lanes | 4 lanes | >4 lanes |
|---|---|---|---|---|
| \(\geq\) 70 | 4,800 | 7,200 | 9,600 | 2,400/ln |
| 65 | 4,700 | 7,050 | 9,400 | 2,350/ln |
| 60 | 4,600 | 6,900 | 9,200 | 2,300/ln |
| 55 | 4,500 | 6,750 | 9,000 | 2,250/ln |
| FFS (mi/h) | Maximum Desirable Flow Rate (\(v_{R12}\)), in pc/h, Entering Merge Influence Area\(^b\) | Maximum Desirable Flow Rate (\(v_{12}\)), in pc/h, Entering Diverge Influence Area\(^b\) |
|---|---|---|
| \(\geq\) 70 | 4,600 | 4,400 |
| 65 | 4,600 | 4,400 |
| 60 | 4,600 | 4,400 |
| 55 | 4,600 | 4,400 |
Notes:
- Demand in excess of these capacities results in LOS F.
- Demand in excess of these values alone does not result in LOS F; operations may be worse than predicted by this methodology.
The third limit is most important because it is the primary reason for failure of diverge areas.
Failure at a diverge is most often related to the capacity of one of the exit legs, usually the ramp.
The capacity of each exit leg must be checked against the expected demand.
Capacity Values: Ramp Roadways, in pc/h
- HCM Exhibit 14-12
| Ramp FFS, \(S_{FR}\) (mi/h) | Single-Lane Ramps | Two-Lane Ramps |
|---|---|---|
| > 50 | 2200 | 4400 |
| > 40-50 | 2100 | 4200 |
| > 30-40 | 2000 | 4000 |
| \(\geq\) 20-30 | 1900 | 3800 |
| < 20 | 1800 | 3600 |
6.4.8 Step 4: Estimate Density and Determine LOS
The density within the merge or diverge influence area (\(D_{R}\)) and the level of service based on this value are determined.
on-ramp
\[D_{R} = 5.475 + 0.00734v_{R}+ 0.0078v_{12} - 0.00627L_A\tag{HCM Eq. 14-22}\]off-ramp
\[D_{R} = 4.252 + 0.0086v_{12} - 0.009L_D\tag{HCM Eq. 14-23}\]
The level of service is based on density, according to Exhibit 14-3.
| Level of Service | Density (pc/mi/ln) |
|---|---|
| A | \(\leq\) 10 |
| B | > 10-20 |
| C | > 20-28 |
| D | > 28-35 |
| E | > 35 |
| F | Demand exceeds capacity |
6.4.9 Step 5: Estimation of Speed
If desired, the estimation of average travel speed (\(S_{R}\)) within the ramp influence area may be computed.
This may be useful information, but it should not be used as a measure of level of service unless density is unavailable.
On-Ramp (HCM Exhibit 14-13)
- Average speed in ramp influence area
\[S_{R} = FFS \times SAF - \left(FFS \times SAF - 42 \right)M_{S}\]
\[M_{s} = 0.321 + 0.0039e^{\frac{v_{R12}}{1000}} - 0.002\left(\frac{L_{A} \times S_{FR} \times {SAF}}{1000} \right)\]
- Average speed in outer lanes of freeway
\[S_{O} = FFS \times SAF; ~~~ v_{OA}< 500 \text { pc/h}\] \[S_{O} = FFS \times SAF - 0.0036(v_{OA} - 500); ~~~ 500 \leq v_{OA} \leq 2,300 \text { pc/h}\] \[S_{O} = FFS \times SAF - 6.53 - 0.006(v_{OA}- 2,300); ~~~ v_{OA} > 2,300 \text { pc/h}\]
Off-Ramp (HCM Exhibit 14-14)
Average speed in ramp influence area
\[S_{R} = FFS \times SAF - \left(FFS \times SAF - 42 \right)D_{S}\] \[D_{S} = 0.883 + 0.00009v_{R} - 0.013S_{FR} \times SAF\]Average speed in outer lanes of freeway
\[S_{O} = 1.097 \times FFS \times SAF; ~~~ v_{OA} < 1000\text { pc/h}\] \[S_{O} = 1.097 \times FFS \times SAF - 0.0039(v_{OA} - 1,000); ~~~ v_{OA} ≥ 1,000 \text { pc/h}\]
HCM Exhibit 14-15
- Average flow in outer lanes \(v_{OA}\) (pc/h/ln)
\[v_{OA} = \frac{v_{f} - v_{12}}{N_{O}}\]
- Average speed for on-ramp (merge) junctions (mi/h)
\[S = \frac{v_{R12} + v_{OA}\left(N_{O} \right)}{\left(\frac{v_{R12}}{S_{R}} \right) + \left( \frac{v_{OA}\left(N_{O} \right)}{S_{O}} \right)}\]
- Average speed for off-ramp (diverge junctions (mi/h)
\[S = \frac{v_{12} + v_{OA}\left(N_{O} \right)}{\left(\frac{v_{12}}{S_{R}} \right) + \left( \frac{v_{OA}\left(N_{O} \right)}{S_{O}} \right)}\]
6.5 Variable Definitions (1)
- \(S_{R}\) = average speed of vehicles within the ramp influence area (mi/h); for merge areas, this includes all ramp and freeway vehicles in Lanes 1 and 2; for diverge areas, this includes all vehicles in Lanes 1 and 2;
- \(S_{O}\) = average speed of vehicles in outer lanes of the freeway, adjacent to the 1,500-ft ramp influence area (mi/h);
- \(S\) = average speed of all vehicles in all lanes within the 1,500-ft length covered by the ramp influence area (mi/h);
- \(FFS\) = free-flow speed of the freeway (mi/h);
- \(S_{FR}\) = free-flow speed of the ramp (mi/h);
- \(L_A\) = length of acceleration lane (ft);
- \(L_D\) = length of deceleration lane (ft);
6.6 Variable Definitions (2)
- \(v_R\) = demand flow rate on ramp (pc/h);
- \(v_{12}\) = demand flow rate in Lanes 1 and 2 of the freeway immediately upstream of the ramp influence area (pc/h);
- \(v_{R12}\) = total demand flow rate entering the on-ramp influence area, including \(v_{12}\) and \(v_R\) (pc/h);
- \(v_{OA}\) = average demand flow per lane in outer lanes adjacent to the ramp influence area (not including flow in Lanes 1 and 2) (pc/h/ln);
- \(v_F\) = demand flow rate on freeway immediately upstream of the ramp influence area (pc/h);
- \(N_O\) = number of outer lanes on the freeway (1 for a six-lane freeway; 2 for an eight-lane freeway) (ln);
- \(M_S\) = speed index for on-ramps (merge areas); this is simply an intermediate computation that simplifies the equations; and
- \(D_S\) = speed index for off-ramps (diverge areas); this is simply an intermediate computation that simplifies the equations.
6.7 References
Transportation Research Board (2022). Highway Capacity Manual, 7th Edition: A Guide for Multimodal Mobility Analysis. Transportation Research Board, Washington, DC. https://nap.nationalacademies.org/catalog/26432/highway-capacity-manual-7th-edition-a-guide-for-multimodal-mobility