Chapter 4 HCM Basic Freeway Segments
4.1 Introduction
A freeway may be defined as a divided highway with full control of access and two or more lanes for the exclusive use of traffic in each direction.
Freeways are categorized as uninterrupted flow facilities. There are no signalized or stop-controlled at-grade intersections, and direct access to and from adjacent property is not permitted.
Access to and from the freeway is limited to ramp locations. Opposing directions of flow are continuously separated by a raised barrier, an at-grade median, or a raised traffic island.
Operating conditions on a freeway primarily result from interactions among vehicles and drivers in the traffic stream and between vehicles and their drivers and the geometric characteristics of the freeway.
Operations can also be affected by environmental conditions, such as weather or lighting conditions, by pavement conditions, and by the occurrence of traffic incidents.
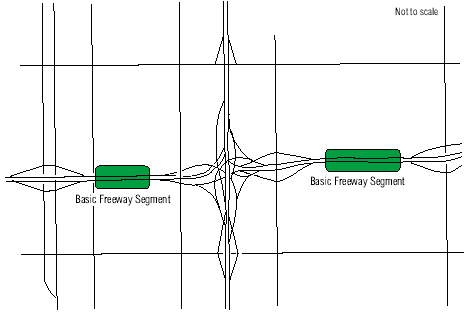
A freeway consists of three component parts:
- Basic freeway segments: Segments of the freeway that are outside of the influence area of ramps or weaving areas.
- Weaving areas: Segments of the freeway where two or more vehicle flows must cross each other’s path along a length of the freeway. They are usually formed when an on-ramp is followed by an off-ramp and the two are connected by an auxiliary lane.
- Merge/Diverge areas: Points at which on- and off-ramps join the freeway. The junction formed at this point is an area of turbulence because of concentrations of merging or diverging vehicles.
4.3 Performance Measures
A basic freeway segment is typically characterized by three main performance measures:
- density in terms of passenger cars per mile per lane,
- speed in terms of mean passenger car speed, and
- volume-to-capacity ratio.
Each of these measures is an indication of how well or how poorly traffic flow is being accommodated by the freeway segment.
4.4 Service Measure
Although speed is a major indicator of service quality to drivers, freedom to maneuver within the traffic stream and proximity to other vehicles are equally noticeable concerns.
These other concerns are related to the density of the traffic stream. Furthermore, unlike speed, density increases as flow increases up to capacity, resulting in a measure of effectiveness that is sensitive to a broad range of flows.
4.5 Level of Service
For these reasons, density is the performance measure used to define levels of service for basic freeway segments (thus referred to as the service measure). The ranges of density used to define levels of service are as follows:
HCM Exhibit 12-15
| Level of Service | Density (pc/mi/ln) |
|---|---|
| A | \(\leq\) 11 |
| B | > 11-18 |
| C | > 18-26 |
| D | > 26-35 |
| E | > 35-45 |
| F | > 45 or Demand exceeds capacity |
4.6 Speed-Flow Relationship
(HCM Eq. 12-1)
\[S=\left\{\begin{array}{l l}
FFS_{adj} & {\text {if }v_p \leq {BP}} \\
FFS_{adj} - \frac{\left({FFS}_{adj} - \frac{c_{adj}}{D_{c}} \right)\left(v_{p} - {BP} \right)^{2.0}}{\left(c_{adj} - BP \right)^{2.0}} & {\text {if } BP < v_p \leq c}
\end{array}\right.\]
\(c\) = Capacity in pc/h/ln,
\(v_p\) = 15-min passenger car equivalent flow rate in pc/h/ln,
\(BP\) = Linear to curvilinear flow rate breakpoint value in pc/h/ln, and
\(D_c\) = Density at capacity (45 pc/mi/ln).
\[FFS_{adj} = {FFS} \times{SAF}\tag{HCM Exhibit 12-6}\]
\[c = \text{Min}\left\lbrack 2200 + 10\left({FF}S_{adj} - 50 \right),2400 \right\rbrack {~~~~~ 55 \leq {FFS} \leq 75} \tag{HCM Exhibit 12-6}\]
\[c_{adj} = {c} \times{CAF}\tag {HCM Exhibit 12-6}\]
\[BP = \left\lbrack 1000 + 40\left( 75 - {FFS}_{adj} \right) \right\rbrack \times {CAF}^{2} {~~~~~ 55 \leq {FFS} \leq 75} \tag{HCM Exhibit 12-6}\]
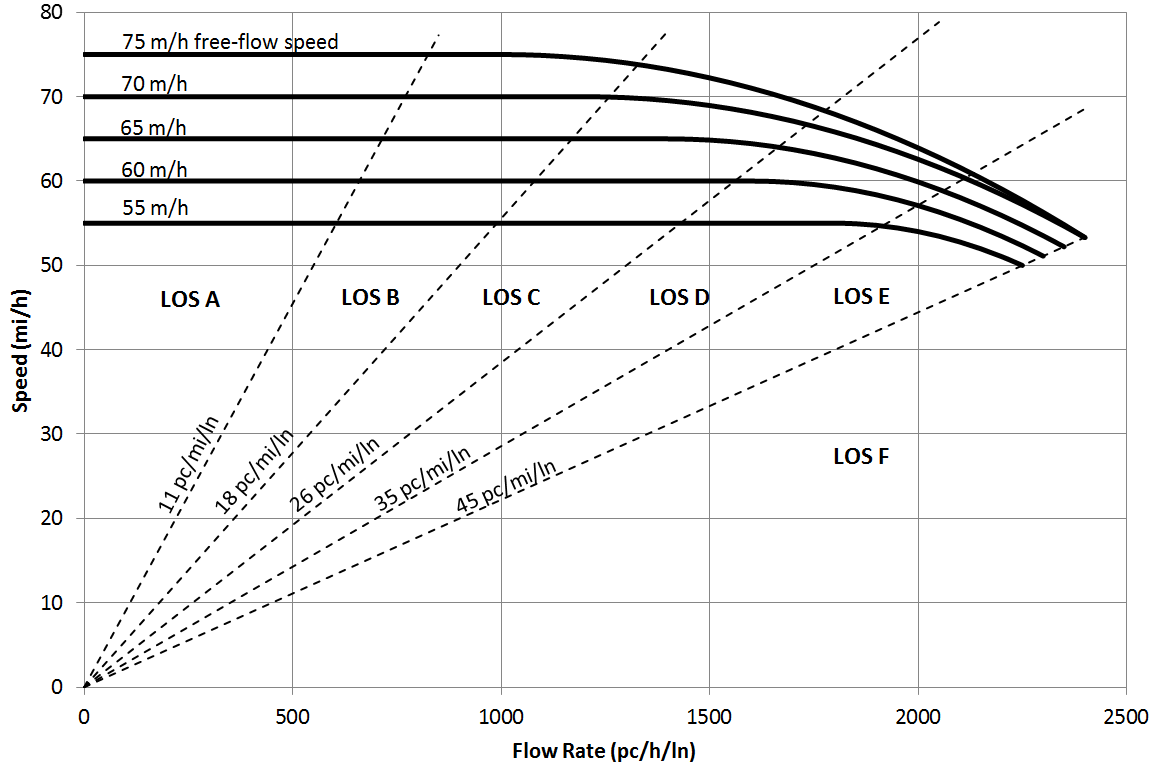
Figure 4.2: Basic Freeway Segment Speed-Flow Curves (source: HCM Exhibit 12-16)
4.7 Analysis Procedure
- Specify Input Data
- Estimate or Measure Free-Flow Speed
- Estimate and Adjust Capacity
- Calculate Analysis Flow Rate
- Estimate Speed and Density
- Determine LOS
4.8 Base Conditions
- Minimum lane widths of 12 ft
- Minimum right-shoulder lateral clearance between the edge of the travel lane and the nearest obstacle or object influencing traffic behavior of 6 ft (minimum median lateral clearance is 2 ft)
- Traffic stream consisting of passenger cars only
- No on- or off-ramps within 3-mi upstream or 3-mi downstream of segment midpoint
- Level terrain, with grades no greater than 2%; and
- Driver population dominated by familiar users of the roadway (handled through free-flow speed and capacity adjustment factors)
4.9 Free-Flow Speed
Free-flow speed is the mean speed of passenger cars measured under low to moderate flow rates.
Two methods can be used to determine the free-flow speed of the basic freeway segment being studied: field measurement or estimation with guidelines provided in the HCM.
4.10 Estimating FFS
Estimation of a free-flow speed for an existing or future freeway segment being studied is accomplished by adjusting the base free-flow speed downward to reflect the influence of three factors:
- lane width,
- lateral clearance, and
- ramp density.
Estimation of a free-flow speed for an existing or future freeway segment being studied is done according to the following equation:
\[FFS = 75.4 - f_{LW} - f_{RLC} - 3.22\left({TRD} \right)^{0.84}\tag{HCM Eq. 12-2}\]
FFS = free-flow speed (mi/h)
75.4 = base free-flow speed (mi/h)
\(f_{LW}\) = adjustment for lane width from Table 6.3 (Exhibit 12-20) (mi/h)
\(f_{RLC}\) = adjustment for right-shoulder lateral clearance from Table 6.4 (Exhibit 12-21) (mi/h)
TRD = total ramp density (ramps/mi)
4.10.1 Lane Width Adjustment Factor
HCM Exhibit 12-20
| Lane width (ft) | Reduction in free-flow speed, \(f_{LW}\) (mi/h) |
|---|---|
| 12 | 0.0 |
| 11 | 1.9 |
| 10 | 6.6 |
4.10.2 Lateral Clearance Adj. Factor
HCM Exhibit 12-21 Reduction in free-flow speed, \(f_{RLC}\) (mi/h), for the number of lanes in one direction (2-5+)
| Right-shoulder lateral clearance (ft) | 2 | 3 | 4 | \(\geq\) 5 |
|---|---|---|---|---|
| \(\geq\) 6 | 0.0 | 0.0 | 0.0 | 0.0 |
| 5 | 0.6 | 0.4 | 0.2 | 0.1 |
| 4 | 1.2 | 0.8 | 0.4 | 0.2 |
| 3 | 1.8 | 1.2 | 0.6 | 0.3 |
| 2 | 2.4 | 1.6 | 0.8 | 0.4 |
| 1 | 3.0 | 2.0 | 1.0 | 0.5 |
| 0 | 3.6 | 2.4 | 1.2 | 0.6 |
4.11 Calculate Analysis Flow Rate
\[v_{p} = \frac{V}{{PHF} \times N \times f_{HV}}\tag{HCM Eq. 12-9}\]
vp = 15-min passenger car equivalent flow rate in pc/h/ln,
V = hourly volume in veh/h,
PHF = peak-hour factor,
N = number of lanes, and
fHV = heavy-vehicle adjustment factor.
4.11.1 Peak Hour Factor
\[PHF = \frac{V}{V_{15} \times 4}\tag{HCM Eq. 4-2}\]
PHF = peak-hour factor,
V = hourly volume for hour of analysis,
V15 = maximum 15-min volume within hour of analysis, and
4 = number of 15-min periods per hour.
4.11.2 Passenger Car Equivalency (PCE) Factor
Need to account for traffic mix – trucks/buses and RV’s
Also need to account for grade conditions. Passenger-car equivalents can be selected for one of two conditions:
- extended general freeway segments
- specific grades
4.11.3 Extended General Freeway Segments
It is often possible to consider an extended length of freeway containing a number of upgrades, downgrades, and level segments as a single uniform segment.
This is possible when no one grade is long enough or steep enough to have a significant effect on the overall operation of the general segment.
As a guideline, extended general segment analysis can be used where no one grade of 3 percent or greater is longer than 1/4 mi or where no one grade of less than 3 percent is longer than 1/2 mi.
Whenever extended general segment analysis is used, the terrain of the freeway must be classified as level or rolling.
Level Terrain. Any combination of grades and horizontal or vertical alignment that permits heavy vehicles to maintain the same speed as passenger cars is classified as level terrain. This classification generally includes short grades of no more than 2 percent.
Rolling Terrain. Any combination of grades and horizontal or vertical alignment that causes heavy vehicles to reduce their speeds substantially below those of passenger cars but that does not cause heavy vehicles to operate at crawl speeds for any significant length of time or at frequent intervals is classified as rolling terrain.
HCM Exhibit 12-25 Type of Terrain
| Terrain | ET |
|---|---|
| Level | 2.0 |
| Rolling | 3.0 |
4.11.4 Specific Grades
When the analysis segment consists of terrain that cannot be considered as an extended general segment (i.e., level, rolling), Exhibits 12-26, 12-27, and 12-28 can be used to determine PCE values for specific upgrades and/or downgrades.
Exhibit 12-26 Passenger Car Equivalents (ET) for Heavy Vehicles
(30% SUTs/70% TTs) on Specific Grades
| ——————- | —————– | Percentage of Heavy Vehicles |
|---|
| Grade (%) | Length (mi) | 2 | 4 | 5 | 6 | 8 | 10 | 15 | 20 | \(\geq\) 25 |
|---|---|---|---|---|---|---|---|---|---|---|
| \(\leq\) 0 | \(\leq\) 0.125 | 2.62 | 2.37 | 2.3 | 2.24 | 2.17 | 2.12 | 2.04 | 1.99 | 1.97 |
| 0.375 | 2.62 | 2.37 | 2.3 | 2.24 | 2.17 | 2.12 | 2.04 | 1.99 | 1.97 | |
| 0.625 | 2.62 | 2.37 | 2.3 | 2.24 | 2.17 | 2.12 | 2.04 | 1.99 | 1.97 | |
| 0.875 | 2.62 | 2.37 | 2.3 | 2.24 | 2.17 | 2.12 | 2.04 | 1.99 | 1.97 | |
| 1.25 | 2.62 | 2.37 | 2.3 | 2.24 | 2.17 | 2.12 | 2.04 | 1.99 | 1.97 | |
| \(\geq\) 1.5 | 2.62 | 2.37 | 2.3 | 2.24 | 2.17 | 2.12 | 2.04 | 1.99 | 1.97 | |
| 2 | \(\leq\) 0.125 | 2.62 | 2.37 | 2.3 | 2.24 | 2.17 | 2.12 | 2.04 | 1.99 | 1.97 |
| 0.375 | 3.76 | 2.96 | 2.78 | 2.65 | 2.48 | 2.38 | 2.22 | 2.14 | 2.09 | |
| 0.625 | 4.47 | 3.33 | 3.08 | 2.91 | 2.68 | 2.54 | 2.34 | 2.23 | 2.17 | |
| 0.875 | 4.8 | 3.5 | 3.22 | 3.03 | 2.77 | 2.61 | 2.39 | 2.28 | 2.21 | |
| 1.25 | 5 | 3.6 | 3.3 | 3.09 | 2.83 | 2.66 | 2.42 | 2.3 | 2.23 | |
| \(\geq\) 1.5 | 5.04 | 3.62 | 3.32 | 3.11 | 2.84 | 2.67 | 2.43 | 2.31 | 2.23 | |
| 2.5 | \(\leq\) 0.125 | 2.62 | 2.37 | 2.3 | 2.24 | 2.17 | 2.12 | 2.04 | 1.99 | 1.97 |
| 0.375 | 4.11 | 3.14 | 2.93 | 2.78 | 2.58 | 2.46 | 2.28 | 2.19 | 2.13 | |
| 0.625 | 5.04 | 3.62 | 3.32 | 3.11 | 2.84 | 2.67 | 2.43 | 2.31 | 2.23 | |
| 0.875 | 5.48 | 3.85 | 3.51 | 3.27 | 2.96 | 2.77 | 2.5 | 2.36 | 2.28 | |
| 1.25 | 5.73 | 3.98 | 3.61 | 3.36 | 3.03 | 2.83 | 2.54 | 2.4 | 2.31 | |
| \(\geq\) 1.5 | 5.8 | 4.02 | 3.64 | 3.38 | 3.05 | 2.84 | 2.55 | 2.41 | 2.32 | |
| 3.5 | \(\leq\) 0.125 | 2.62 | 2.37 | 2.3 | 2.24 | 2.17 | 2.12 | 2.04 | 1.99 | 1.97 |
| 0.375 | 4.88 | 3.54 | 3.25 | 3.05 | 2.8 | 2.63 | 2.41 | 2.29 | 2.22 | |
| 0.625 | 6.34 | 4.3 | 3.87 | 3.58 | 3.2 | 2.97 | 2.64 | 2.48 | 2.38 | |
| 0.875 | 7.03 | 4.66 | 4.16 | 3.83 | 3.39 | 3.12 | 2.76 | 2.57 | 2.46 | |
| 1.25 | 7.44 | 4.87 | 4.33 | 3.97 | 3.5 | 3.22 | 2.82 | 2.62 | 2.5 | |
| \(\geq\) 1.5 | 7.53 | 4.92 | 4.38 | 4.01 | 3.53 | 3.24 | 2.84 | 2.63 | 2.51 | |
| 4.5 | \(\leq\) 0.125 | 2.62 | 2.37 | 2.3 | 2.24 | 2.17 | 2.12 | 2.04 | 1.99 | 1.97 |
| 0.375 | 5.8 | 4.02 | 3.64 | 3.38 | 3.05 | 2.84 | 2.55 | 2.41 | 2.32 | |
| 0.625 | 7.9 | 5.11 | 4.53 | 4.14 | 3.63 | 3.32 | 2.9 | 2.68 | 2.55 | |
| 0.875 | 8.91 | 5.64 | 4.96 | 4.5 | 3.92 | 3.56 | 3.07 | 2.82 | 2.67 | |
| \(\geq\) 1.0 | 9.19 | 5.78 | 5.08 | 4.6 | 3.99 | 3.62 | 3.11 | 2.85 | 2.7 | |
| 5.5 | \(\leq\) 0.125 | 2.62 | 2.37 | 2.3 | 2.24 | 2.17 | 2.12 | 2.04 | 1.99 | 1.97 |
| 0.375 | 6.87 | 4.58 | 4.1 | 3.77 | 3.35 | 3.09 | 2.73 | 2.55 | 2.44 | |
| 0.625 | 9.78 | 6.09 | 5.33 | 4.82 | 4.16 | 3.76 | 3.21 | 2.93 | 2.77 | |
| 0.875 | 11.2 | 6.83 | 5.94 | 5.33 | 4.56 | 4.09 | 3.45 | 3.12 | 2.93 | |
| \(\geq\) 1.0 | 11.6 | 7.04 | 6.11 | 5.47 | 4.67 | 4.18 | 3.51 | 3.17 | 2.97 | |
| ≥ 6 | \(\leq\) 0.125 | 2.62 | 2.37 | 2.3 | 2.24 | 2.17 | 2.12 | 2.04 | 1.99 | 1.97 |
| 0.375 | 7.48 | 4.9 | 4.36 | 3.99 | 3.52 | 3.23 | 2.83 | 2.63 | 2.51 | |
| 0.625 | 10.87 | 6.66 | 5.79 | 5.21 | 4.46 | 4.01 | 3.39 | 3.08 | 2.89 | |
| 0.875 | 12.54 | 7.54 | 6.51 | 5.81 | 4.94 | 4.4 | 3.67 | 3.3 | 3.08 | |
| \(\geq\) 1.0 | 13.02 | 7.78 | 6.71 | 5.99 | 5.07 | 4.51 | 3.75 | 3.37 | 3.14 |
Exhibit 12-27 Passenger Car Equivalents (ET) for Heavy Vehicles
(50% SUTs/50% TTs) on Specific Grades
| Grade (%) | Length (mi) | 2 | 4 | 5 | 6 | 8 | 10 | 15 | 20 | \(\geq\) 25 |
|---|---|---|---|---|---|---|---|---|---|---|
| \(\leq\) 0 | \(\leq\) 0.125 | 2.67 | 2.38 | 2.31 | 2.25 | 2.16 | 2.11 | 2.02 | 1.97 | 1.93 |
| 0.375 | 2.67 | 2.38 | 2.31 | 2.25 | 2.16 | 2.11 | 2.02 | 1.97 | 1.93 | |
| 0.625 | 2.67 | 2.38 | 2.31 | 2.25 | 2.16 | 2.11 | 2.02 | 1.97 | 1.93 | |
| 0.875 | 2.67 | 2.38 | 2.31 | 2.25 | 2.16 | 2.11 | 2.02 | 1.97 | 1.93 | |
| 1.25 | 2.67 | 2.38 | 2.31 | 2.25 | 2.16 | 2.11 | 2.02 | 1.97 | 1.93 | |
| \(\geq\) 1.5 | 2.67 | 2.38 | 2.31 | 2.25 | 2.16 | 2.11 | 2.02 | 1.97 | 1.93 | |
| 2 | \(\leq\) 0.125 | 2.67 | 2.38 | 2.31 | 2.25 | 2.16 | 2.11 | 2.02 | 1.97 | 1.93 |
| 0.375 | 3.76 | 2.95 | 2.77 | 2.64 | 2.47 | 2.36 | 2.2 | 2.11 | 2.06 | |
| 0.625 | 4.32 | 3.24 | 3.01 | 2.84 | 2.63 | 2.49 | 2.29 | 2.19 | 2.12 | |
| 0.875 | 4.57 | 3.37 | 3.11 | 2.93 | 2.7 | 2.55 | 2.33 | 2.22 | 2.15 | |
| 1.25 | 4.71 | 3.45 | 3.17 | 2.99 | 2.74 | 2.58 | 2.36 | 2.24 | 2.17 | |
| \(\geq\) 1.5 | 4.74 | 3.47 | 3.19 | 3 | 2.75 | 2.59 | 2.36 | 2.24 | 2.17 | |
| 2.5 | \(\leq\) 0.125 | 2.67 | 2.38 | 2.31 | 2.25 | 2.16 | 2.11 | 2.02 | 1.97 | 1.93 |
| 0.375 | 4.1 | 3.13 | 2.92 | 2.77 | 2.57 | 2.44 | 2.26 | 2.16 | 2.1 | |
| 0.625 | 4.84 | 3.52 | 3.23 | 3.03 | 2.77 | 2.61 | 2.38 | 2.26 | 2.18 | |
| 0.875 | 5.17 | 3.69 | 3.37 | 3.15 | 2.87 | 2.69 | 2.43 | 2.3 | 2.22 | |
| 1.25 | 5.36 | 3.79 | 3.45 | 3.22 | 2.92 | 2.73 | 2.47 | 2.33 | 2.24 | |
| \(\geq\) 1.5 | 5.4 | 3.81 | 3.47 | 3.24 | 2.93 | 2.74 | 2.47 | 2.33 | 2.25 | |
| 3.5 | \(\leq\) 0.125 | 2.67 | 2.38 | 2.31 | 2.25 | 2.16 | 2.11 | 2.02 | 1.97 | 1.93 |
| 0.375 | 4.89 | 3.54 | 3.25 | 3.05 | 2.79 | 2.62 | 2.39 | 2.26 | 2.19 | |
| 0.625 | 6.05 | 4.15 | 3.75 | 3.47 | 3.11 | 2.89 | 2.58 | 2.42 | 2.32 | |
| 0.875 | 6.58 | 4.43 | 3.97 | 3.66 | 3.26 | 3.01 | 2.67 | 2.49 | 2.39 | |
| 1.25 | 6.88 | 4.58 | 4.1 | 3.77 | 3.35 | 3.09 | 2.72 | 2.53 | 2.42 | |
| \(\geq\) 1.5 | 6.95 | 4.62 | 4.13 | 3.8 | 3.37 | 3.1 | 2.73 | 2.54 | 2.43 | |
| 4.5 | \(\leq\) 0.125 | 2.67 | 2.38 | 2.31 | 2.25 | 2.16 | 2.11 | 2.02 | 1.97 | 1.93 |
| 0.375 | 5.83 | 4.03 | 3.65 | 3.39 | 3.05 | 2.84 | 2.55 | 2.39 | 2.3 | |
| 0.625 | 7.53 | 4.92 | 4.38 | 4.01 | 3.53 | 3.24 | 2.83 | 2.62 | 2.5 | |
| 0.875 | 8.32 | 5.34 | 4.72 | 4.29 | 3.75 | 3.42 | 2.97 | 2.73 | 2.59 | |
| \(\geq\) 1.0 | 8.53 | 5.45 | 4.81 | 4.37 | 3.81 | 3.47 | 3 | 2.76 | 2.62 | |
| 5.5 | \(\leq\) 0.125 | 2.67 | 2.38 | 2.31 | 2.25 | 2.16 | 2.11 | 2.02 | 1.97 | 1.93 |
| 0.375 | 6.97 | 4.63 | 4.14 | 3.81 | 3.38 | 3.11 | 2.74 | 2.55 | 2.43 | |
| 0.625 | 9.37 | 5.89 | 5.16 | 4.68 | 4.05 | 3.67 | 3.14 | 2.88 | 2.72 | |
| 0.875 | 10.49 | 6.48 | 5.65 | 5.09 | 4.37 | 3.93 | 3.34 | 3.03 | 2.85 | |
| \(\geq\) 1.0 | 10.8 | 6.64 | 5.78 | 5.2 | 4.46 | 4.01 | 3.39 | 3.08 | 2.89 | |
| ≥ 6 | \(\leq\) 0.125 | 2.67 | 2.38 | 2.31 | 2.25 | 2.16 | 2.11 | 2.02 | 1.97 | 1.93 |
| 0.375 | 7.64 | 4.98 | 4.43 | 4.05 | 3.56 | 3.26 | 2.85 | 2.64 | 2.51 | |
| 0.625 | 10.45 | 6.45 | 5.63 | 5.07 | 4.36 | 3.92 | 3.33 | 3.03 | 2.85 | |
| 0.875 | 11.78 | 7.16 | 6.2 | 5.56 | 4.74 | 4.24 | 3.56 | 3.22 | 3.01 | |
| \(\geq\) 1.0 | 12.15 | 7.35 | 6.36 | 5.69 | 4.85 | 4.33 | 3.62 | 3.27 | 3.05 |
Exhibit 12-28 Passenger Car Equivalents (ET) for Heavy Vehicles
(70% SUTs/30% TTs) on Specific Grades
| Grade (%) | Length (mi) | 2 | 4 | 5 | 6 | 8 | 10 | 15 | 20 | ≥ 25 |
|---|---|---|---|---|---|---|---|---|---|---|
| \(\leq\) 0 | \(\leq\) 0.125 | 2.39 | 2.18 | 2.12 | 2.07 | 2.01 | 1.96 | 1.89 | 1.85 | 1.83 |
| 0.375 | 2.39 | 2.18 | 2.12 | 2.07 | 2.01 | 1.96 | 1.89 | 1.85 | 1.83 | |
| 0.625 | 2.39 | 2.18 | 2.12 | 2.07 | 2.01 | 1.96 | 1.89 | 1.85 | 1.83 | |
| 0.875 | 2.39 | 2.18 | 2.12 | 2.07 | 2.01 | 1.96 | 1.89 | 1.85 | 1.83 | |
| 1.25 | 2.39 | 2.18 | 2.12 | 2.07 | 2.01 | 1.96 | 1.89 | 1.85 | 1.83 | |
| \(\geq\) 1.5 | 2.39 | 2.18 | 2.12 | 2.07 | 2.01 | 1.96 | 1.89 | 1.85 | 1.83 | |
| 2 | \(\leq\) 0.125 | 2.67 | 2.32 | 2.23 | 2.17 | 2.08 | 2.03 | 1.94 | 1.89 | 1.86 |
| 0.375 | 3.63 | 2.82 | 2.64 | 2.52 | 2.35 | 2.25 | 2.1 | 2.02 | 1.97 | |
| 0.625 | 4.12 | 3.08 | 2.85 | 2.69 | 2.49 | 2.36 | 2.18 | 2.08 | 2.02 | |
| 0.875 | 4.37 | 3.21 | 2.96 | 2.78 | 2.56 | 2.42 | 2.22 | 2.11 | 2.05 | |
| 1.25 | 4.53 | 3.29 | 3.02 | 2.84 | 2.6 | 2.45 | 2.24 | 2.13 | 2.07 | |
| \(\geq\) 1.5 | 4.58 | 3.31 | 3.04 | 2.86 | 2.61 | 2.46 | 2.25 | 2.14 | 2.07 | |
| 2.5 | \(\leq\) 0.125 | 2.75 | 2.36 | 2.27 | 2.2 | 2.11 | 2.04 | 1.95 | 1.9 | 1.87 |
| 0.375 | 4.01 | 3.02 | 2.8 | 2.65 | 2.46 | 2.33 | 2.16 | 2.06 | 2.01 | |
| 0.625 | 4.66 | 3.35 | 3.08 | 2.88 | 2.64 | 2.48 | 2.26 | 2.15 | 2.08 | |
| 0.875 | 4.99 | 3.52 | 3.21 | 3 | 2.73 | 2.56 | 2.32 | 2.19 | 2.12 | |
| 1.25 | 5.2 | 3.64 | 3.3 | 3.08 | 2.79 | 2.6 | 2.35 | 2.22 | 2.14 | |
| \(\geq\) 1.5 | 5.26 | 3.67 | 3.33 | 3.1 | 2.8 | 2.62 | 2.36 | 2.23 | 2.15 | |
| 3.5 | \(\leq\) 0.125 | 2.93 | 2.45 | 2.34 | 2.26 | 2.16 | 2.09 | 1.98 | 1.92 | 1.89 |
| 0.375 | 4.86 | 3.46 | 3.16 | 2.96 | 2.69 | 2.53 | 2.3 | 2.18 | 2.1 | |
| 0.625 | 5.88 | 3.99 | 3.59 | 3.32 | 2.98 | 2.76 | 2.46 | 2.31 | 2.22 | |
| 0.875 | 6.4 | 4.26 | 3.81 | 3.51 | 3.12 | 2.88 | 2.55 | 2.38 | 2.28 | |
| 1.25 | 6.74 | 4.43 | 3.96 | 3.63 | 3.21 | 2.96 | 2.6 | 2.42 | 2.32 | |
| \(\geq\) 1.5 | 6.83 | 4.48 | 3.99 | 3.66 | 3.24 | 2.98 | 2.62 | 2.44 | 2.33 | |
| 4.5 | \(\leq\) 0.125 | 3.13 | 2.56 | 2.43 | 2.34 | 2.21 | 2.13 | 2.01 | 1.95 | 1.91 |
| 0.375 | 5.88 | 3.99 | 3.59 | 3.32 | 2.98 | 2.76 | 2.46 | 2.31 | 2.22 | |
| 0.625 | 7.35 | 4.75 | 4.22 | 3.85 | 3.39 | 3.1 | 2.71 | 2.51 | 2.39 | |
| 0.875 | 8.11 | 5.15 | 4.54 | 4.13 | 3.6 | 3.27 | 2.83 | 2.61 | 2.47 | |
| ≥ 1.0 | 8.33 | 5.27 | 4.63 | 4.21 | 3.66 | 3.33 | 2.87 | 2.64 | 2.5 | |
| 5.5 | \(\leq\) 0.125 | 3.37 | 2.69 | 2.53 | 2.42 | 2.28 | 2.19 | 2.05 | 1.98 | 1.94 |
| 0.375 | 7.09 | 4.62 | 4.11 | 3.76 | 3.31 | 3.04 | 2.66 | 2.47 | 2.36 | |
| 0.625 | 9.13 | 5.68 | 4.97 | 4.49 | 3.88 | 3.51 | 3 | 2.74 | 2.59 | |
| 0.875 | 10.21 | 6.24 | 5.43 | 4.88 | 4.18 | 3.76 | 3.18 | 2.89 | 2.71 | |
| \(\geq\) 1.0 | 10.52 | 6.41 | 5.57 | 5 | 4.27 | 3.83 | 3.24 | 2.93 | 2.75 | |
| ≥ 6 | \(\leq\) 0.125 | 3.51 | 2.76 | 2.59 | 2.47 | 2.32 | 2.22 | 2.08 | 2 | 1.95 |
| 0.375 | 7.78 | 4.98 | 4.4 | 4.01 | 3.51 | 3.2 | 2.78 | 2.56 | 2.44 | |
| 0.625 | 10.17 | 6.23 | 5.42 | 4.87 | 4.17 | 3.75 | 3.18 | 2.88 | 2.71 | |
| 0.875 | 11.43 | 6.88 | 5.95 | 5.32 | 4.53 | 4.04 | 3.39 | 3.06 | 2.86 | |
| \(\geq\) 1.0 | 11.81 | 7.08 | 6.11 | 5.46 | 4.64 | 4.13 | 3.45 | 3.11 | 2.9 |
An average grade technique can be used for composite grades that meet the following condition:
All subsection grades are less than 4% OR the total length of the composite grade is less than 4,000 ft.
4.11.5 Heavy Vehicle Factor
\[f_{HV} = \frac{1}{1 + P_{T}\left( E_{T} - 1 \right)}\tag{HCM Eq. 12-10}\]
\(f_{HV}\) = heavy-vehicle adjustment factor,
\(P_{T}\) = proportion of heavy vehicles in the traffic stream, and
\(E_{T}\) = passenger car equivalent for heavy vehicles, from Table 6.5, 6.6, 6.7, or 6.8 (Exhibits 12-25 – 12-28 HCM).
4.12 Calculate Density
\[D = \frac{v_{p}}{S}\tag{HCM Eq. 12-11}\]
D = density in pc/mi/ln,
\(v_{p}\) = flow rate in pc/h/ln, and
S = average passenger car speed in mi/h.
LOS Criteria for Basic Freeway Segments (Mannering and Washburn, Table 6.2)
| FFS (mi/h) | Criterion | A | B | C | D | E |
|---|---|---|---|---|---|---|
| 75 | Maximum density (pc/mi/ln) | 11 | 18 | 26 | 35 | 45 |
| Average speed (mi/h) | 75 | 73.9 | 68.3 | 60.9 | 53.3 | |
| Maximum v/c | 0.34 | 0.55 | 0.74 | 0.89 | 1.0 | |
| Maximum flow rate (pc/h/ln) | 825 | 1330 | 1775 | 2130 | 2400 | |
| 70 | Maximum density (pc/mi/ln) | 11 | 18 | 26 | 35 | 45 |
| Average speed (mi/h) | 70 | 70 | 66.7 | 60.4 | 53.3 | |
| Maximum v/c | 0.32 | 0.53 | 0.72 | 0.88 | 1.0 | |
| Maximum flow rate (pc/h/ln) | 770 | 1260 | 1735 | 2115 | 2400 | |
| 65 | Maximum density (pc/mi/ln) | 11 | 18 | 26 | 35 | 45 |
| Average speed (mi/h) | 65 | 65 | 64 | 58.9 | 52.2 | |
| Maximum v/c | 0.3 | 0.5 | 0.71 | 0.88 | 1.0 | |
| Maximum flow rate (pc/h/ln) | 715 | 1170 | 1665 | 2060 | 2350 | |
| 60 | Maximum density (pc/mi/ln) | 11 | 18 | 26 | 35 | 45 |
| Average speed (mi/h) | 60 | 60 | 60 | 57.1 | 51.1 | |
| Maximum v/c | 0.29 | 0.47 | 0.68 | 0.87 | 1.0 | |
| Maximum flow rate (pc/h/ln) | 660 | 1080 | 1560 | 2000 | 2300 | |
| 55 | Maximum density (pc/mi/ln) | 11 | 18 | 26 | 35 | 45 |
| Average speed (mi/h) | 55 | 55 | 55 | 54.7 | 50 | |
| Maximum v/c | 0.27 | 0.44 | 0.64 | 0.85 | 1.0 | |
| Maximum flow rate (pc/h/ln) | 605 | 990 | 1430 | 1915 | 2250 |
4.13 Service Volumes/Flow Rates
The ‘Maximum flow rate’ entries in the above table are generally referred to as service flow rates. A Service flow rate is the maximum hourly rate at which persons or vehicles can reasonably be expected to traverse a point or uniform section of a lane or roadway during a given period under prevailing roadway, traffic, and control conditions while a designated level of service is maintained.
The service flow rates are generally based on a 15-min period. Typically, the hourly flow rate is defined as four times the peak 15-min volume.
The procedures attempt to establish or predict the maximum rate of flow that can be accommodated by various facilities at each level of service, except LOS F, for which flows are unstable. Thus each facility has five service flow rates, one for each level of service (A through E).
Note that service flow rates are discrete values, whereas levels of service represent a range of conditions.
Because the service flow rates are defined as maximums for each level of service, they effectively define flow boundaries between the various levels of service.
4.14 Driver Population Adjustment
Accounting for the negative influence of non-familiar drivers on traffic flow efficiency is handled through capacity and free-flow speed adjustment factors, per the following table.
HCM Exhibit 26-9
| Level of Driver Familiarity | CAFpop | SAFpop |
|---|---|---|
| All familiar drivers, regular commuters | 1.000 | 1.000 |
| Mostly familiar drivers | 0.968 | 0.975 |
| Balanced mix of familiar and unfamiliar drivers | 0.939 | 0.950 |
| Mostly unfamiliar drivers | 0.898 | 0.913 |
| All or overwhelmingly unfamiliar drivers | 0.852 | 0.863 |
4.15 References
Transportation Research Board (2022). Highway Capacity Manual, 7th Edition: A Guide for Multimodal Mobility Analysis. Transportation Research Board, Washington, DC. https://nap.nationalacademies.org/catalog/26432/highway-capacity-manual-7th-edition-a-guide-for-multimodal-mobility
Mannering, Fred L. and Washburn, Scott S. Principles of Highway Engineering and Traffic Analysis, 7th Edition. Wiley & Sons, 2019.