1.6 Growing Freight Movement
- Improvements in railroad productivity resulted primarily from deregulation, divestiture of uneconomic lines, reductions in the labor force, and changes in technology and logistics. Productivity improvements in trucking resulted primarily from public investments in a high-quality national road network and deregulation.
- The volume of freight moved by the U.S. transportation system has grown dramatically in recent decades and is projected to increase nearly 70 percent by 2020.
- The liberalization of trade policies, such as the North American Free Trade Agreement (NAFTA), internationalization of supply chains, and changes in transportation and information technologies have contributed to this increase in freight movement.
- As a share of the gross domestic product (GDP), U.S. exports and imports grew from 9 percent in 1960 to 23 percent in 2002. U.S. international trade is forecast to reach 37 percent of GDP by 2025.
- Trucks carried about 71 percent of all tonnage and 80 percent of the value of U.S. shipments in 1998.
- Even with growth in airfreight, maritime, and rail services, the percentage of urban interstates carrying more than 10,000 trucks daily is expected to increase from 27 percent in 1998 to 69 percent in 2020.
- In recent years, trade growth has increased the number of commercial vehicles on U.S. roadways and, indirectly, the potential demand for more productive and larger commercial trucks. Trucks move a majority of freight tonnage.
- In 2002, 7.9 million large trucks (trucks with six or more tires) were on the road, compared with 6.2 million in 1990, and trucks contributed to 7.5 percent of all vehicle miles traveled in 2002.
- Trucks transported the vast majority of freight by both weight and value in 2018 (68% and 73%, respectively). While pipelines and rail together accounted for over 25% of freight tonnage, they accounted for just over 12% of freight value. Domestic freight movement in 2018 totaled 16.5 billion tons with a total value of $14.8 billion.
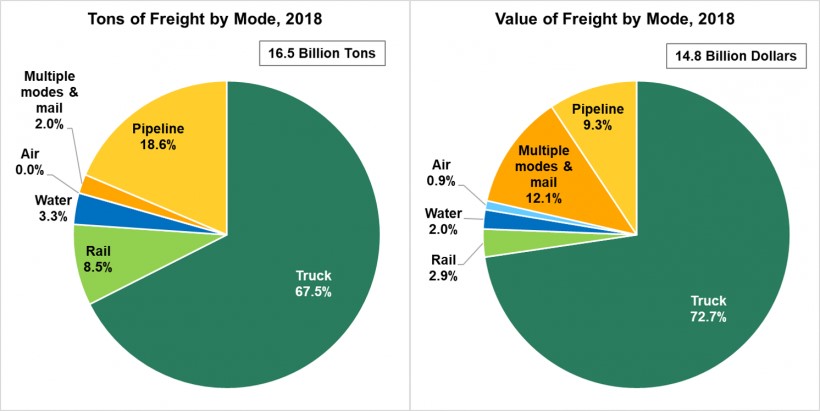
Figure 1.6: Freight by Mode, 2018
Source: U.S. Department of Transportation, Freight Analysis Framework, Version 4.5.1, December 2019. Data Tabulation Tool queried July 2, 2020.